
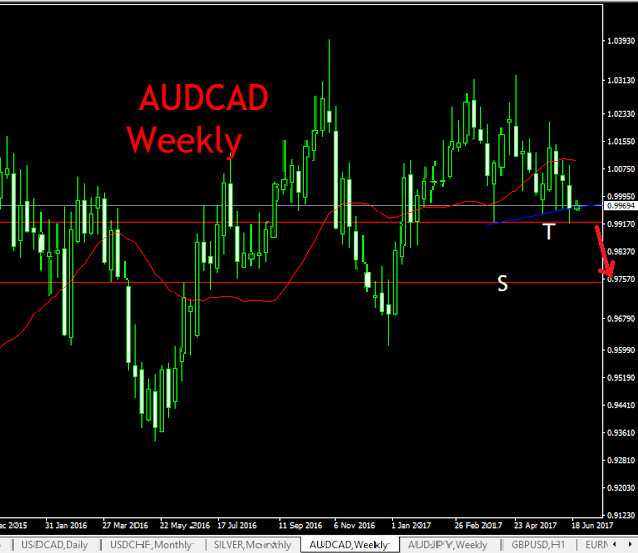
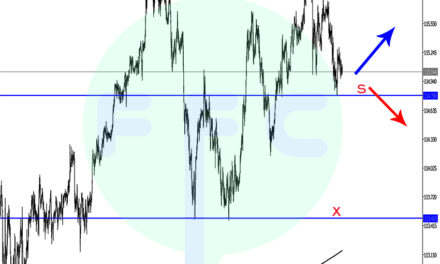
WEEKLY CHART
The price already shows strong signs of bearishness as it is being held by support zone marked T. Confirmation of fall of the price will be close of the weekly candle below support zone marked by red horizontal line marked T around 0.99164. This may lead lead price into a larger pivotal support zone marked S around 0.97464.
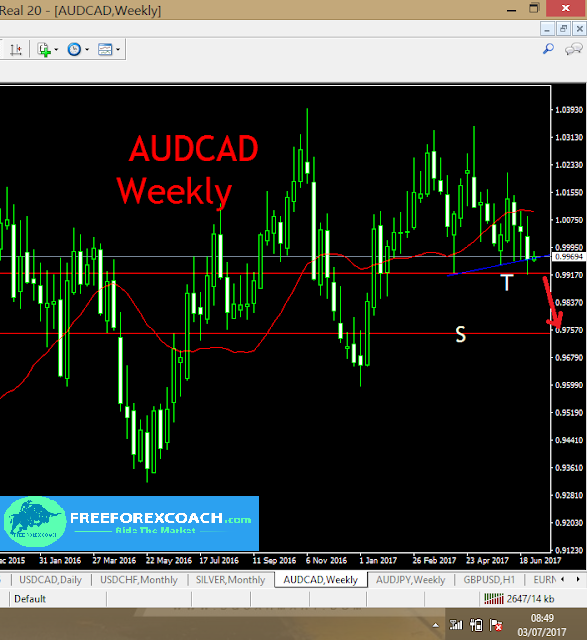
As we wait for weekly candle confirmation, lets us see what we can be playing intra-day.
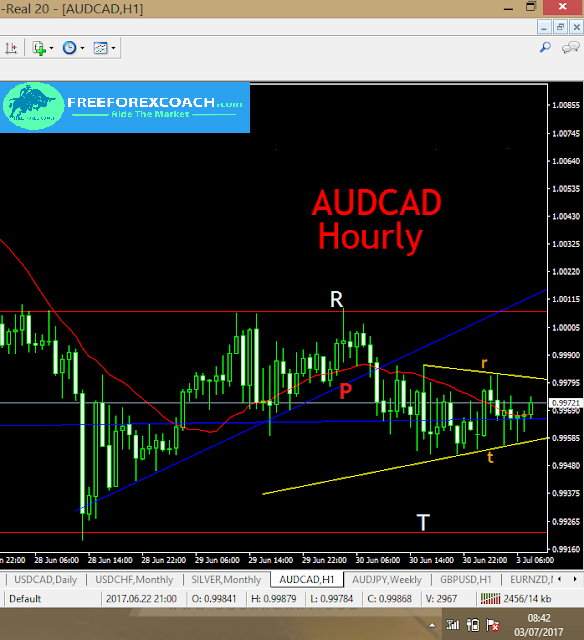
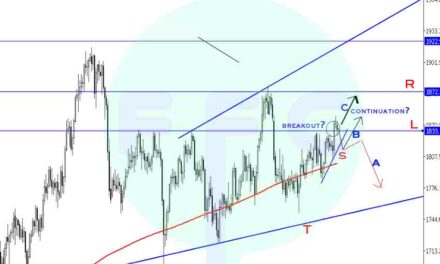
HOURLY CHART
Intra-day trading on the hourly chart is more logical to be done between the zone marked by the red horizontal lines R and T shown on the chart below, as we wait for larger timeframe confirmations.
Currently price is held in a congestion marked by small yellow trend lines r and t. Close above r can lead price to retest the R resistance zone and close above t can lead price to retest the previous lows support zone marked T which is the same zone on the weekly chart above.
Since momentum on the downside looks strong and there was just a break of a blue trendline support P, a break below t is highly probable for a downside continuation. But nevertheless, wait for confirmations either way.

