

The US Dollar has shown significant strength against the Australian Dollar since the beginning of 2011. This article is mainly on AUDUSD trendline trading. We shall look at what’s happening currently within the price action.
We shall look at multiple time frames, mainly the monthly chart and the 4-hour time frame chart. Let’s start with the monthly Chart.
Monthly Chart AUDUSD Trendline Trading
From 2011 we had a strong fall in price on the AUDUSD currency pair indicating a great strength in the US Dollar for over 5 years. The fall lasted up to start of 2016 where we started to have choppy movements up down. These choppy movements which i call congestion is what we seeing up to now.
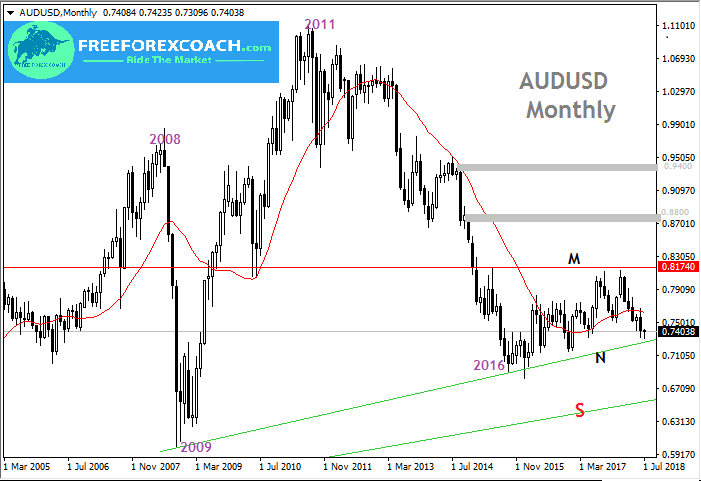
From our chart above the congestion is indicated by support green trend line marked N and the horizontal resistance red line marked M.
The green trend line is from the lows of start of 2009 and the red horizontal resistance from the highs of 1996. This shows these a are quite strong zones of support and resistance respectively.
So when doing AUDUSD trendline trading on the monthly chart, we must wait for monthly candlestick close confirmations. Confirmation doesn’t just mean a trend line break, it means a break and close of the candle beyond the trend line
Therefore trading on the lower time frames must be kept within congestion until we get monthly confirmation for larger targets!
Monthly candle close below the support green trend line marked N may push prices lower to retest the ultimate previous lows support trend line labelled S.
On the other hand, a monthly candle break and close above the horizontal resistance red line marked M, could push prices to higher resistance zone. The 0.88000 zone will be the immediate resistance zone.
A proper reaction and close above the 0.88000 resistance zone targets the 0.9400 zone as the next strong price resistance. This is the same zone that marked the highs of end of 2008.
As we mentioned earlier monthly AUDUSD trendline trading requires monthly candle close beyond support green trendline marked N or horizontal resistance red line marked M. Therefore trading on the lower timeframes must be kept within congestion until we have monthly confirmation!
Now let us look at the a small time frame for short-term trades as we await monthly confirmation.
4-Hour Chart AUDUSD Trendline Trading
The 4- hour chart shows part of the inside price action within the monthly candles. As always AUDUSD trendline trading on any time frame depends on candle close confirmations.
Now let’s take a look at the 4-hour chart below and clearly look at the current price action
The monthly chart above showed current price hovering on the green support trendline. This means we shall opening of price on lower timeframes forming large swings up and down. These are the swings we can capitalise on as we wait for monthly candle confirmation.
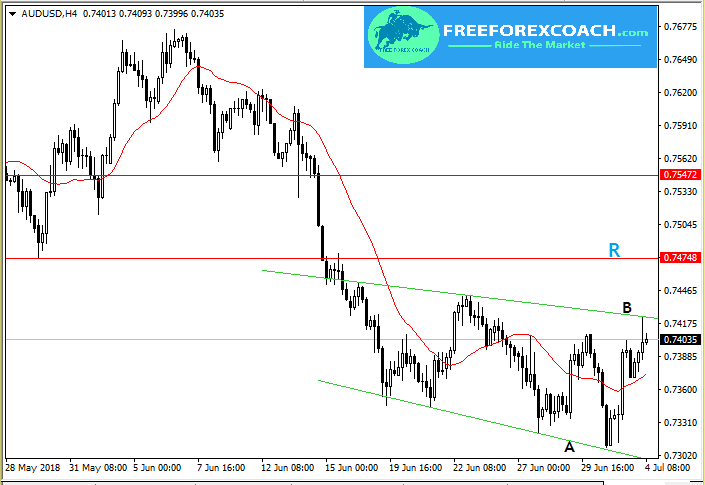
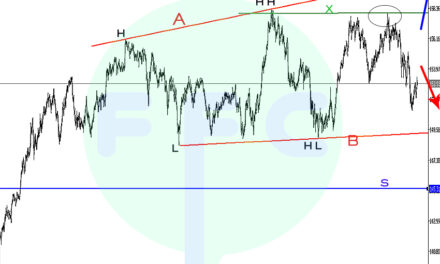
From our chart above, price is now in a channel marked by green support trendlines A and resistance trendline B.
Trading on the time frames lower than 4-hour must be kept within this channel until we have confirmation from the 4-Hour candle close beyond the channel trendlines.
Close of 4-hour candle close above green resistance trendline B may land price into immediate resistance marked by red horizontal line R around 0.74748.
On the hand close of candle below support trendline A may lead price to properly retest the monthly larger support zone. This larger monthly support zone is marked by the Trendline N on the monthly chart above.
Just like i mentioned in some our previous articles, when doing trendline trading and at same time observing multiple timeframes, you analyse from the bigger time frames down to the smaller ones.
Keep trading within the marked zones until confirmation from the main time frame!

