
AUS 200 Index Sell setup is probable due to formation of the head and shoulders pattern on the current price action
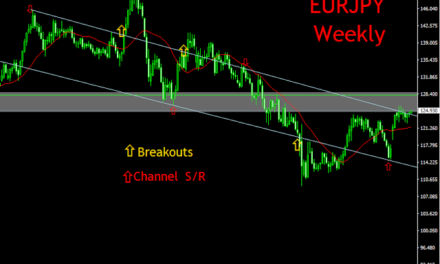
Let’s look at the 4-Hour Chart below in detail
AUS 200 Sell Setup Formation
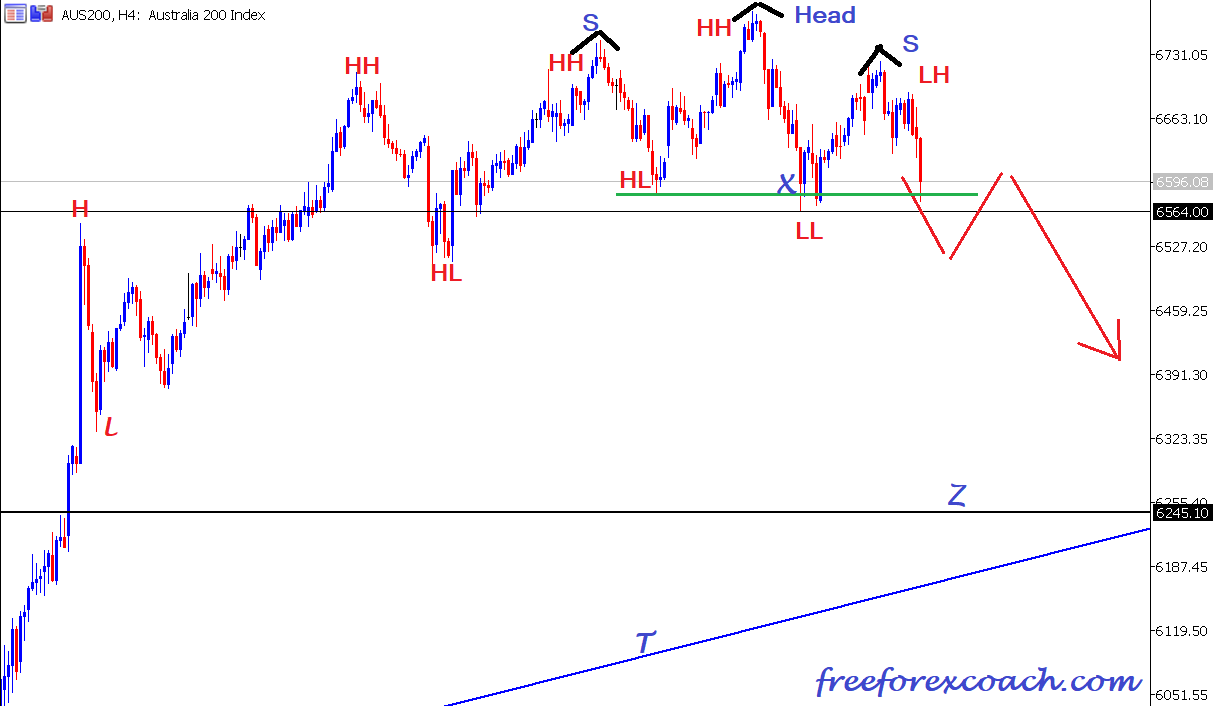
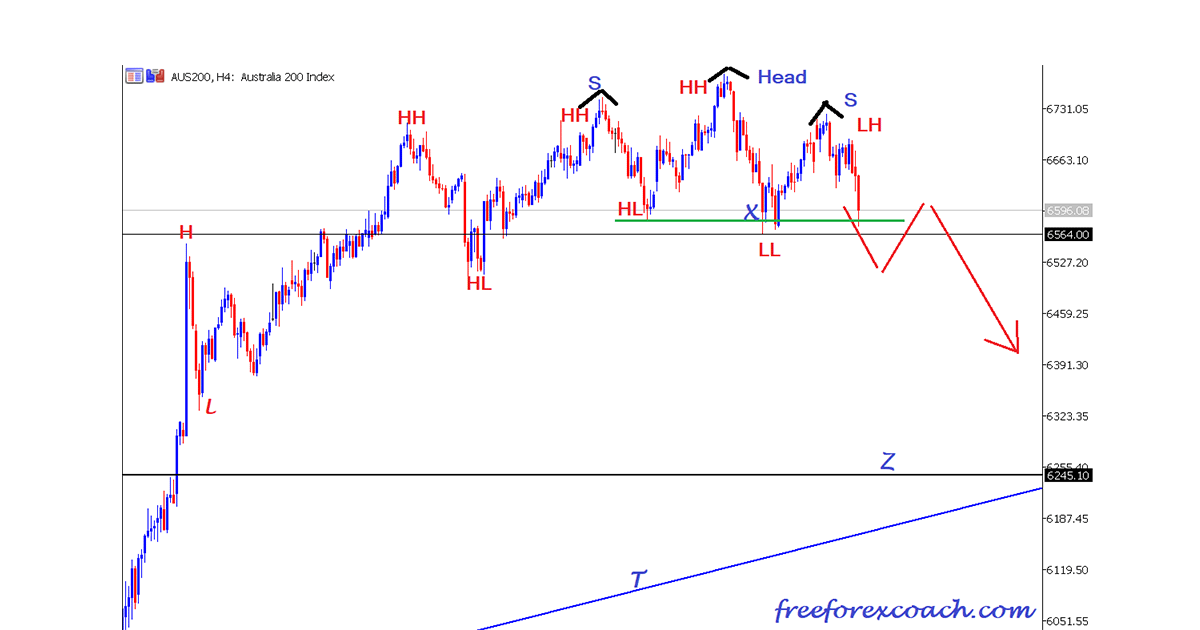
From the AUS 200 chart above you can clearly see price was making higher highs and higher lows indicating an ongoing uptrend.
Then eventually we have price making a lower low at point market X. Most recent upswing, price makes a lower high completing and giving a formation of the head and shoulders pattern.
Head and shoulders pattern indicates a strength/interest shift from buyers to sellers.
The left shoulder is usually part of the trend, so no change of strength can be identified at this point. The swing that forms the head is usually the start of change in strength since the pullback is deep giving a lower high.
This signifies more sellers coming in pushing prices lower and weakening the trend. Right shoulder is clear indication of less buyers since price makes a lower high.
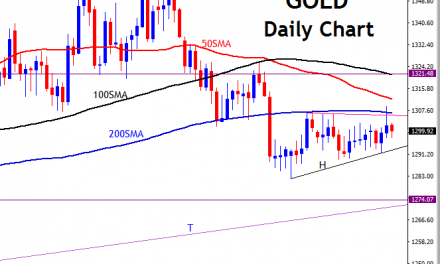
So, from the chart above, we have price forming the head and shoulders pattern indicating a fall in price is under way. This is the basis for the AUS 200 Sell setup. If the pattern confirms, the target zone is the 6245 zone marked Z.
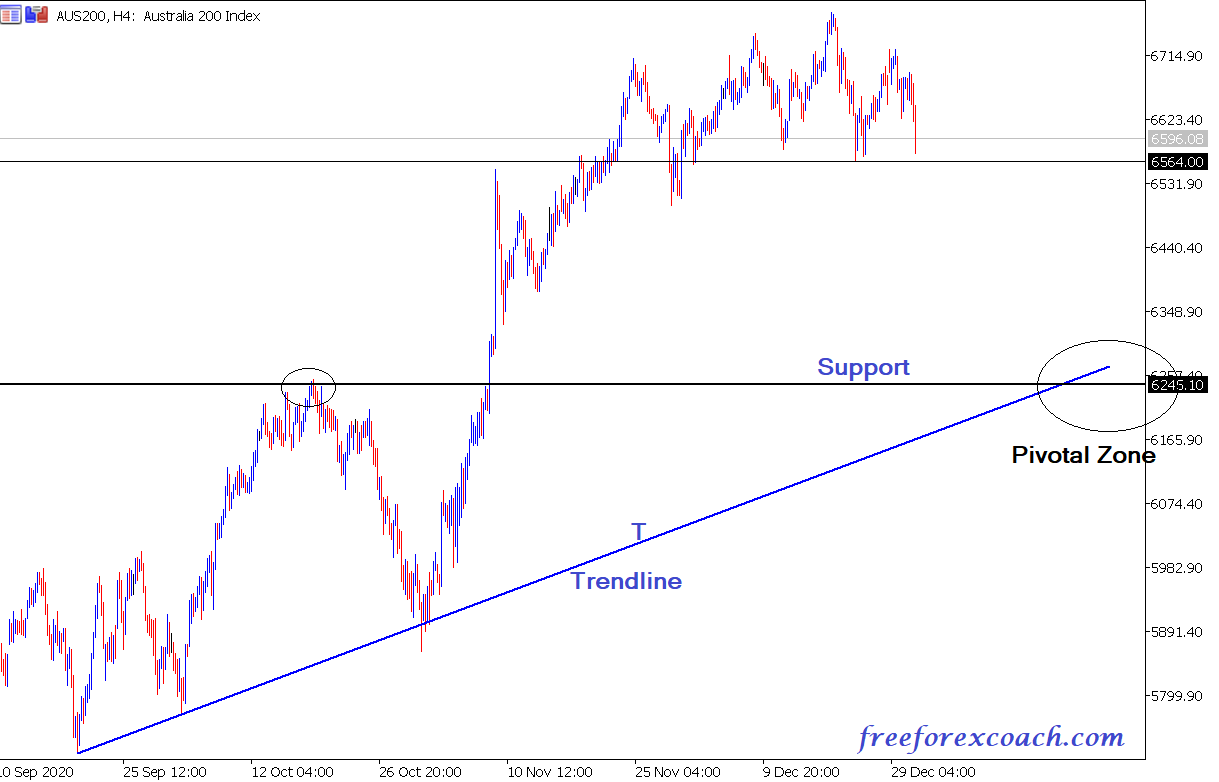
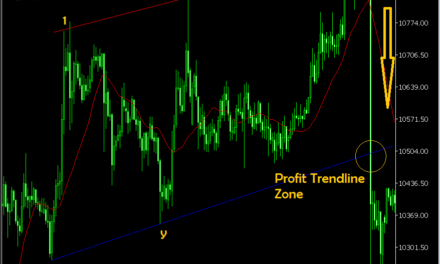
This zone also has the Support Trendline marked T zone. so this will be a pivotal zone for a bounce or for a strong continuation to the downside. Very important to keep an eye on this zone.
Pivotal Zone Shown On Chart below
Conclusion.
It vital to set stop loss on any of the trades you take as a risk management measure. The stop loss on the AUS 200 Index sell setup above preferably would be just above the head swing. This is to avoid any market quick stop outs incase it gives a deep retest after break of neck line
Happy Trading!!

