
Looking at the hourly chart, we have shift in momentum as price is coming into a larger weekly and daily resistance zone. Though our focus is the 30 minute chart for this GBPUSD day trading analysis.
Let’s first take a quick look at H1 (hourly) Chart below;
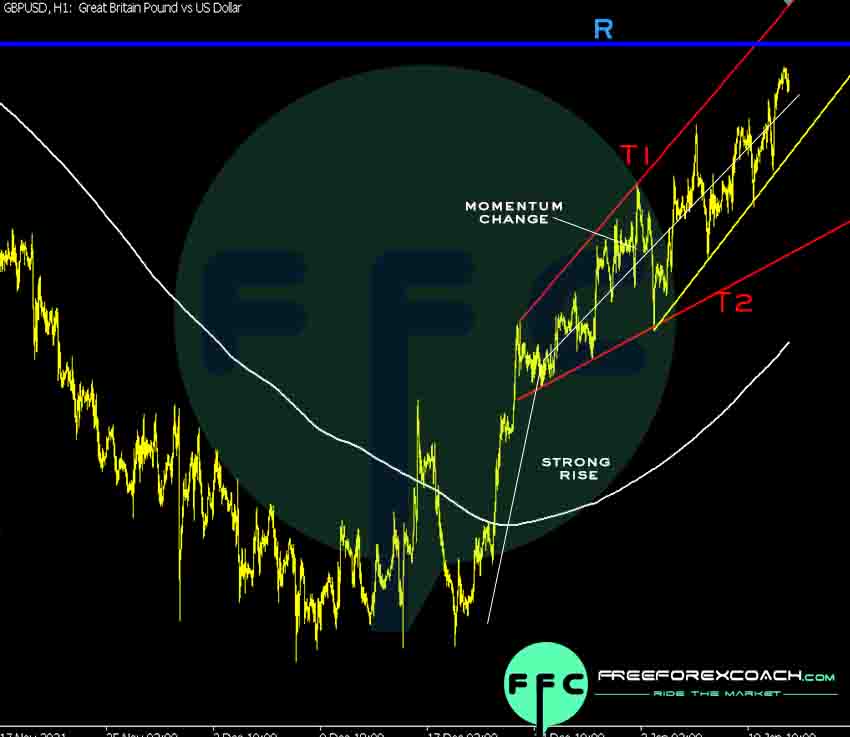
I already mentioned the momentum shift on the chart, right. The momentum shift means the pace or quick price is moving.
In this case, price starts strong (very fast) and then slows down (momentum shift).
When you have price slow down as it comes into a major support/resistance zone, its likely to hold cause price pull back.
From the above chart, price is now into a strong large daily resistance zone therefore we can expect a pullback likely soon.
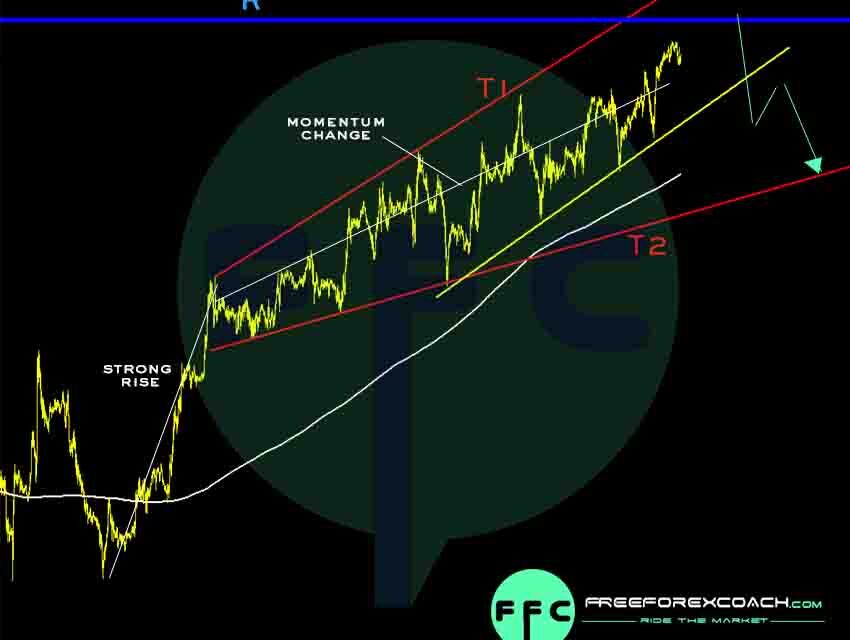
30 min chart is our focus for this GBPUSD Day Trading Analysis, so lets look at the technical chart below;
30 Min GBPUSD Day Trading Analysis
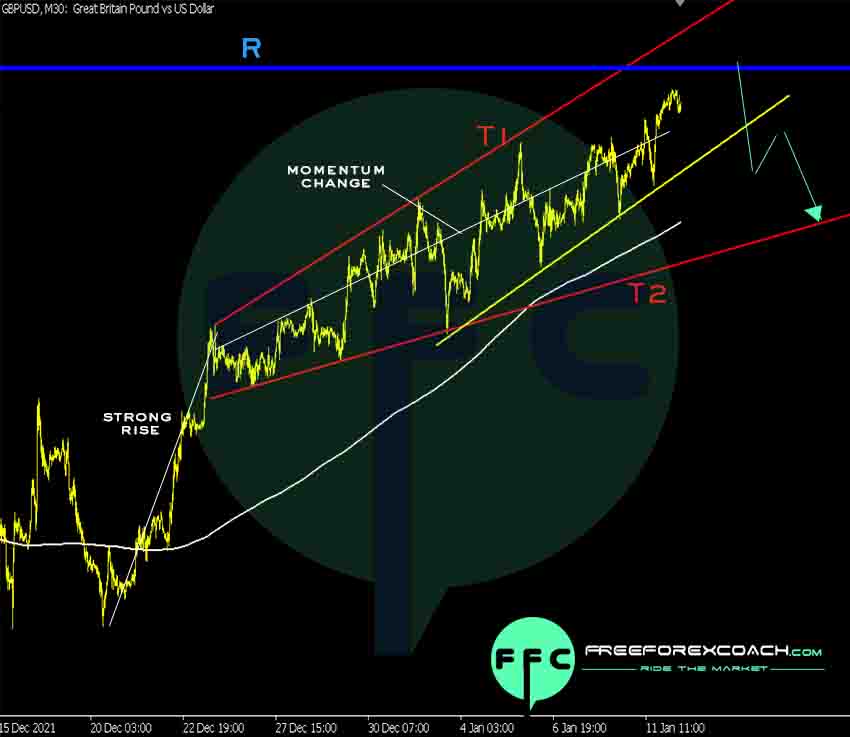
The channel marked by the red trend lines labelled T1 & T2 indicates the momentum shift as price comes into large daily resistance zone. Resistance zone is marked by the blue horizontal line R.
What to watch;
Keep close look on small yellow trend line for any candlestick break. Target is the channel support trend line. If it moves as anticipated, at this point, wait for reaction of price on the channel trend line for a large reversal or continuation.
Key Points to Note
Price is coming into resistance zone. This is a weekly resistance zone, so its a very wide large zone. This is why we choose closer targets in this trading analysis. Price could last a bit longer congesting in the zone on the larger time frames.
Wait for candlestick to actually break and close below yellow trend line before you make any entries.
Happy Cool Trading!

