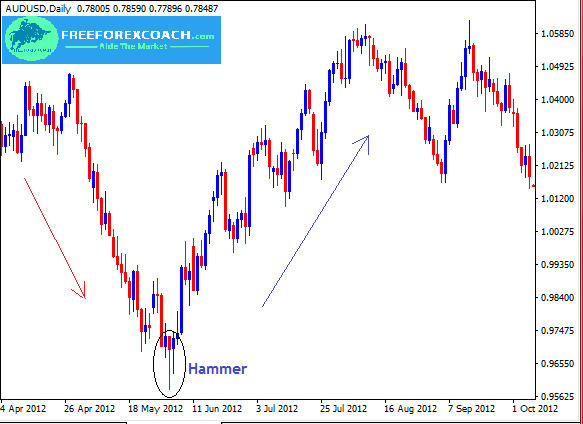
To trade hammer candlestick pattern, there must be a trend. The hammer candlestick pattern appears at the bottom of a down trend and signals a bullish reversal.
The hammer and the hanging man look exactly the same. Both have small bodies near the top of the candlesticks with a long lower shadow and little or no upper shadow.
The hammer and hanging man are both candlestick patterns that indicate trend reversal. The only difference between the two is the nature of the trend in which they appear.
If the pattern appears in a chart with an upward trend, it is a hanging man. This signals a bearish reversal. If it appears in a downward trend, it is a hammer. It a sign of a bullish reversal.
Illustrations of Hanging Man & Hammer candlestick pattern


A hammer candlestick pattern
A hammer is a bullish reversal pattern. It is more bullish and gives a bullish signal when it appears at the end of a downtrend.
The real body of the hammer is at the top of the candlestick. The colour of the body is not very important but a blue hammer is more bullish compared to the red one.
Hammer’s lower shadow should be twice the height of the real body. It can either have a small upper shadow or none.
The long lower shadow indicates that sellers pushed prices lower but the buyers came in and pushed prices back up and closed near the open.
In case you are to trade hammer candlestick pattern as a signal , always wait for a confirmation candlestick. A close of bullish candlestick above the open of right side of the hammer.
The Hammer is more significant at the bottom of a downtrend or at the support.
The Hanging Man candlestick pattern
The a hanging man forms at the top of an uptrend and is a bearish reversal pattern.
The real body of the hanging man is at the top of the candlestick and the colour of the body is not very important. A red hanging man is more bearish compared to the blue one.
Its lower shadow should be twice the height of the real body. It can either have a small upper shadow or none.
The long lower shadow indicates that sellers pushed prices lower but the buyers came in and pushed prices back up and closed near the open.
Unlike the hammer, the appearance of the hanging man on an uptrend shows that sellers are getting stronger compared to the buyers. They have started pushing prices lower.
Therefore buyers can only push prices back as high as near the open. However, as more sellers engage in the market, the buyers will loose control and are out weighed.
If you are to trade using a hanging man as your entry signal, you should always wait for the formation of a strong bearish candlestick as confirmation. The
Hanging man is more significant at the top of an uptrend or at the resistance level.
how to trade Hammer candlestick pattern on a chart
Let’s take a look at the chart below;

The above chart shows the significance of a hammer on a market chart
. Looking at the above chart, you can clearly tell that the appearance of a hammer after a long fall of prices gives a signal for a probable reversal in the trend direction.
This is how identify the signal if you are to trade hammer candlestick pattern.
On the next chart below, we shall see a trend reversal induced by a hammer. Take a look
In Summary
- The hammer candlestick pattern and the hanging man look exactly the same.
- Both have small bodies near the top of the candlesticks with a long lower shadow and little or no upper shadow. The only difference between the two is the nature of the trend in which they appear.
- A hammer appears at the end of a downtrend. The a hanging man forms at the top of an uptrend.
- A hammer is a bullish reversal pattern while a hanging man is a bearish reversal pattern.
- The Hammer candlestick pattern is more significant at the bottom of a downtrend or at the support.
- The Hanging man is more significant at the top of an uptrend or at the resistance level.
Our next interesting candlestick pattern that we going to look at is a shooting star.
Why is it hard for most traders to maintain consistent profits in trading?
You would be suprised at reasons why most Forex Traders fail to Make Money from Trading. They are simple reasons mostly emotional. Out of 100, only 5% of the traders have managed to make CONSISTENT profits and the 95% have failed. Out of 95%, 99% are the new traders....
- Oh, bother! No topics were found here.


