There is nothing as important to a trader than knowing what everybody is thinking in the market. This way you know which direction the market is taking. One way to achieve that is to use pivot points indicator to measure the current market sentiment.
This simply means you can use pivot points to know whether the market is more bullish or bearish.
In the previous lessons, we saw that pivots show strong levels where prices reverse in the market. Therefore, with pivot points, you can easily tell when and where market sentiment changes from “bullish” to “bearish” or the other way around.
In other wards, you can judge whether it’s the buyers or sellers in control of the market.
How do you use Pivot Point to determine market sentiment
In an uptrend, if price breaks the pivot point level, it means the market is more bullish. So it would be good time to buy. However, if prices reach the pivot level and reverse back, it’s an indication that sellers are still in control of the market. Consider selling the currency pair.
On the other hand, if prices in a downtrend break through the pivot point level, it is an indication that the trend is still strong to the downside, SELL. On contrary, incase it reverses back, then that means a shift in sentiment from bearish to bullish. Buy on reversal.
When price breaks up on the resistance, buy. When it breaks the support sell. The opposite is also true.
In addition, you can use pivot point support and resistance levels to determine potential areas where price is likely to hold or reverse.
The pivot points can give you a clue about the current sentiment of the market. They offer the most significant resistance to an uptrend and the highest support to a downtrend.
Bullish Sentiment Vs Bearish Sentiment
If the bulls are stronger than the bears, prices will rise up and above through the pivot point. The market sentiment is more bullish.
On the other hand if the bears manage to push prices down below the pivot level, the market is more bearish.
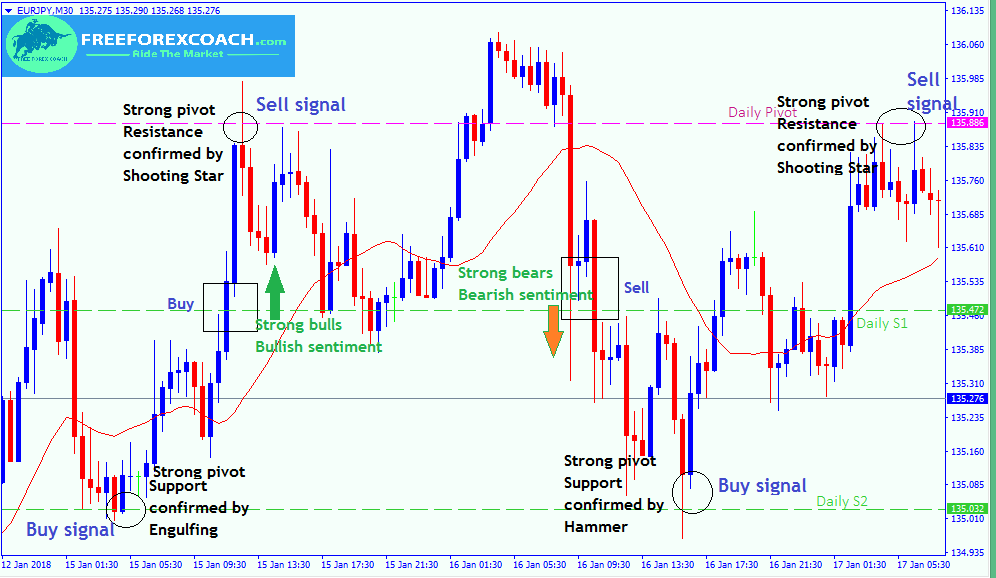
Let’s take a look at the EURJPY chart below;

From our above chart, the Daily Pivot and the Daily S2 are giving the strongest levels of resistance and Support respectively.
We are taking the strong zones of support and resistance to generate our buy and sell trade signals. Since it’s always important to have a strong signal confirmation for high success of a trade. we decided to add reversal Candlestick patterns on our strategy to give us extra confirmation.
For example, if you take a good look at the chart above, areas with black circles indicate the candlestick patterns. You can clearly see the significance of a hammers, shooting stars, and engulfing patterns on the pivot levels.
The strong breaks through Daily S1 indicate strong bearish(downside) and bullish(upside) sentiment indicated by the arrows on the chart
Avaricious Life of a Newbie Trader.
Life of a Newbie Trader in Forex is super Interesting. With a lot of eager to make money, you never want to miss out on any chance. When you read about Forex trading, everything is simple. You may even start to think that your friends may not recognize you after...
- Oh, bother! No topics were found here.


