To combine Fibonacci retracement with candlesticks patterns is one way to enhance your trading strategy.
Previously, we saw how to use reversal candlestick patterns to formulate strategies to trade. These candlestick patterns include; engulfing patterns, Doji, evening & morning stars , piercing patterns, hammer and a shooting star.
The small candlestick patterns such as doji, shooting star, hammer,spinning tool mostly indicate indecision between buyers and sellers.
On the other hand, large candlestick patterns, such as engulfing pattern show the strength of buyers or sellers.
However, to trade these patterns, you need an extra candlestick confirmation to the direction you intend to trade.
Reversal candlestick patterns are more relevant when at the top of an uptrend or bottom of a downtrend. Or else at the support and resistance level hence Fibonacci levels.
If price reverses near a strong support and resistance level, in most cases, you will find a reversal candlestick pattern.
Similarly, if a doji or an engulfing forms right on a Fibonacci retracement level is an additional confirmation that price is ready to reverse.
Therefore reversal candlestick patterns at Fibonacci retracement levels portray a strong signal that price is likely to change direction.
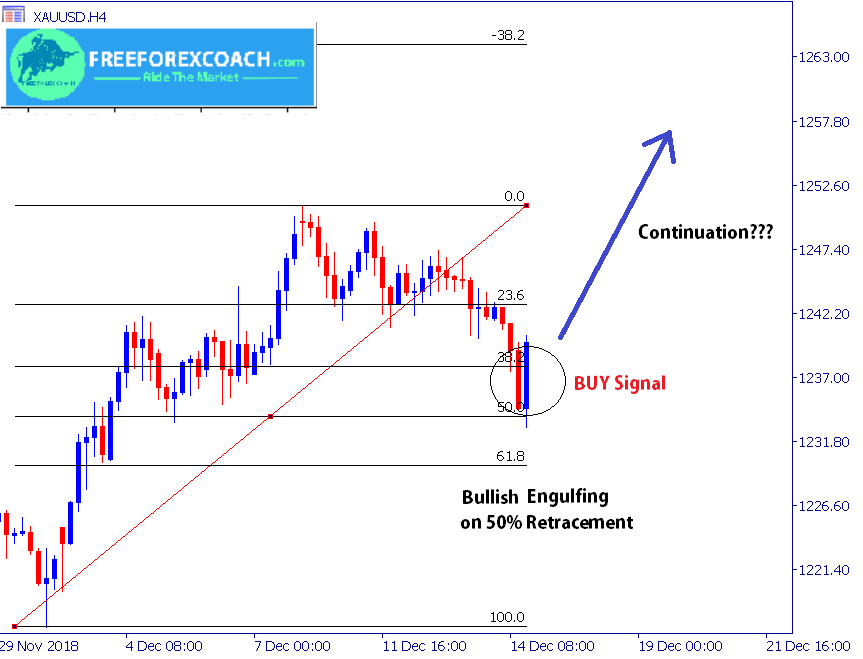
Take a look at the GOLD 4- hour chart below.

Looking at this chart, after drawing the fibonacci retracement levels, you wait for a candlestick pattern formation on the fib levels. Here it formed a bullish engulfing pattern. This a confirmation for a buy signal.
The reversal candlestick pattern cause a great impact on psychological levels in the market. Market psychological levels are support and resistance level, fib retracement levels and trend lines.
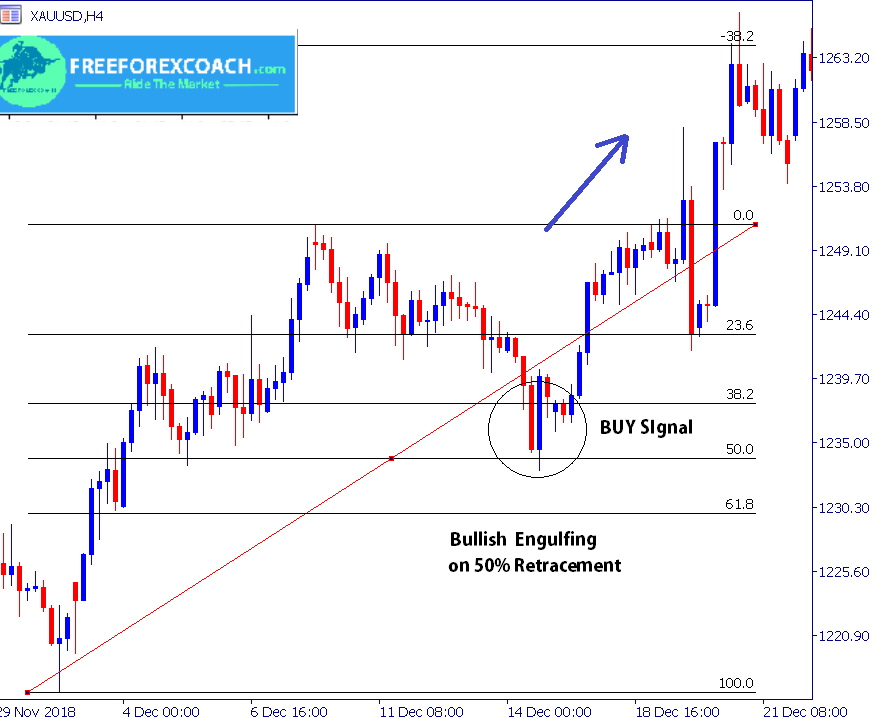
Take a look at the Trade afterwards below;

You can see the level held well and the market continued to move to trade profit direction. When you combine fibonacci retracement with candlestick patterns, you increase your chances for a winning trade
Significance of fibonacci retracement with candlesticks
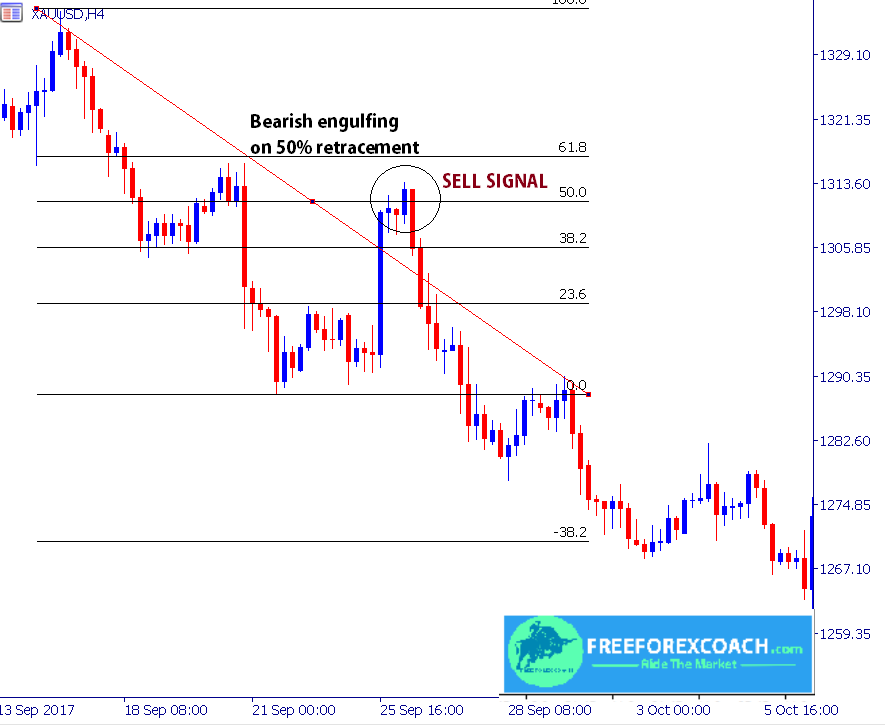
 When a big candlestick pattern such as the bearish engulfing pattern appears on the Fibonacci retracement level;
it gives a strong signal for a trend continuation/reversal.
In this case, it is a downtrend continuation after the bearish engulfing confirmation.
Price is likely to rally for a long time after the close of the bearish candlestick following the the pattern.
In case, it is small candlesticks such as a Doji, spotted on Fibonacci levels, it may signal a possible retracement. However, this may vary depending on the position of a Doji in a trend. A small candlestick may also lead to strong reversal when it forms on top/bottom of an uptrend or downtrend.
All in all, if you combine Fibonacci retracements with Candlesticks. you get strong set ups to trade. Therefore you can rely on them to formulate a trading strategy.
let’s take a look at more chart below;
Fibonacci retracement with an evening star

Whenever you spot a candlestick pattern at a Fibonacci retracement level, always expect a reaction in price behavior.
From the above chart,
you will notice that after a pull back, price hit the 61.8 fib level with a long pin bar candlestick (shooting star). It closed below the same level.
Then a large bearish candlestick confirmed the formation of an evening star candlestick pattern.
It is a two in one. A shooting star in an evening star.
The next two candlesticks form a bearish engulfing. This gives more confirmation.
As a trader, on spot of this, i wouldn’t hesitate to sell. I mean, it’s so clear.
Moreover, an evening star and a shooting star are both bearish reversal pattern.
First, the formation of a shooting star on resistance signifies that there is more selling pressure in the market compared to buying pressure.
Secondary, the long pin bar shows higher prices in the market being rejected.
More so,the next bearish candlestick, moreover confirming an evening star, gave a confirmation that actually the trend is ready to turn.
summary – combine fibonacci retracement with candlesticks patterns
The fact that fib levels are retracement points, when combined with the reversal candlestick patterns, it gives you more odds that the trend will change direction.
Basing on the above signals, you can shot this pair at the close of the next bearish candlestick as indicated on the chart above.
In the same way, when a reversal candlestick pattern appears when price is in consolidation at Fibonacci level, this indicates that the consolidation likely to end. Therefore wait for a signal to buy or sell depending on the direction of price breakout.
If you are trading in an uptrend, do the same. Buy the pair at the confirmation of a bullish reversal candlestick pattern.
Lastly don’t forget that risk management is a key when trading. Don’t forget to set your stop loss levels and target levels as you trade.
Why you make small profits and take big losses?
Major Reason why You make Small profits and take Big Losses in Forex is because you have lost market objectivity. This is due the influence of greed, fear, regret and revenge. You trade what you are thinking instead of what you see! The problem is that traders want to...
- Oh, bother! No topics were found here.


