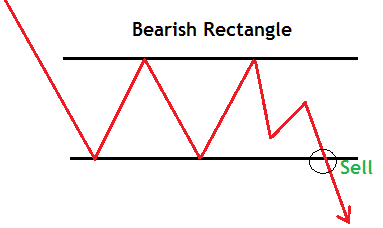
Bearish Rectangle Pattern in Forex mostly appears after a very sharp fall in prices in down-trend representing a small pause in prices. It is a bearish continuation pattern .
After the small pause in price, the trend is likely to continue in its direction after the completion of the pattern.
What is a bearish rectangle pattern
A bearish rectangle pattern in forex is a continuation pattern in a downtrend.
It forms when the prices consolidate for a while during a downtrend.
During this period, price moves in the side ways direction. this is an indication for equal power between the buyers and sellers in the market.
Price moves between the support line and the resistance line forming a trading range with equal highs and lows.
Let’s start with the illustration below;

A breakout and close of candle below the support line confirms the pattern and gives a Sell entry.
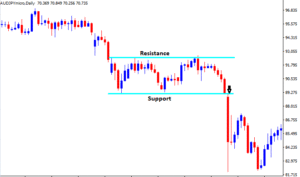
A bearish rectangle pattern in Forex confirmation

From the chart above,
Price broke the support level with high volatility forming a large candlestick below the support.
When this kind of break happens, it doesn’t give you room for entry. Therefore,you don’t chase the trade but let it go and wait for another opportunity to surface.
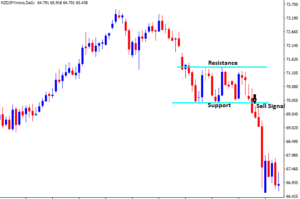
Another example on Rectangle Pattern in Forex

In this case,
We have a good entry point after the pattern confirmation with a breakout on the support level.
The market will always present more opportunities for you so should not be frustrated to miss out one.
Or else you may catch the move when it is ending and you end up making a loss.
How to trade the pattern
The same ways as the bullish rectangle, it’s always important to wait for a breakout confirmation on the support level of bearish rectangle pattern in forex.
Guidelines for trading bearish Rectangle Pattern
- Identify a downtrend
- Spot the rectangle pattern. draw horizontal lines to identify the pattern.
- Sell/short at the close of the bearish candlestick below the support line.
- Set your stop loss slightly above your entry point to the next high.
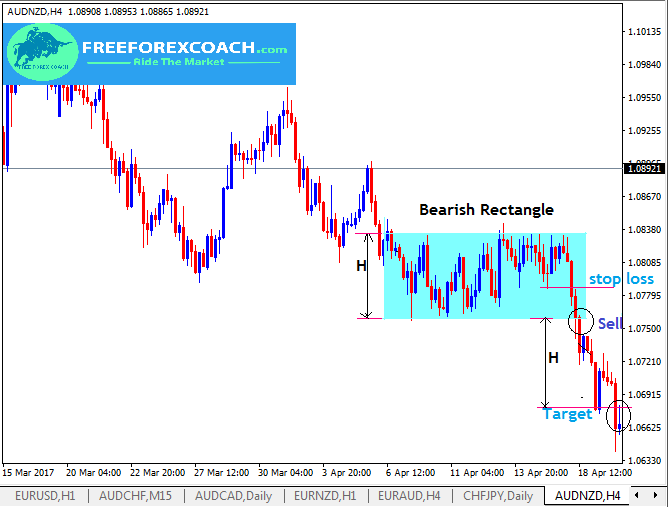
- To determine the target point, measure the distance between the support line and the resistance line i.e the height of the rectangle and project same distance downwards.
Therefore, your target point from entry point should be equal to the distance between the resistance and support line of the rectangle.
Let;s take a look at the AUDNZD, 4-Hour chart below;

From the above chart,
The entry a sell signal is identified by the black circle at the support break.
So the Profit target is got by measuring the height of rectangle (H) and projecting that same distance (H) downwards as shown in the chart above.
Stop loss is set slightly above the entry-level of the pattern.
Why is it hard for most traders to maintain consistent profits in trading?
You would be suprised at reasons why most Forex Traders fail to Make Money from Trading. They are simple reasons mostly emotional. Out of 100, only 5% of the traders have managed to make CONSISTENT profits and the 95% have failed. Out of 95%, 99% are the new traders....
- Oh, bother! No topics were found here.


