You can trade Channel Breakouts in Forex by observing how price reacts on either side of the channel.
Channels work the same way as trend lines. The only difference is the way they are plotted on the chart.
A channel is a combination of both support and resistance lines drawn on the lower and upper side of price movement or trend.
Price in the channel can break out on either side of the channel. Either on the resistance level or the support level.
When price breaks on upper side of the channel, it gives a buy signal or else a sell signal when it breaks the lower line of the channel.
Also, price break on the channel may lead to a trend continuation or reversal.
How to trade channel breakouts in forex
The approach is similar to how we trade trend lines.
After you draw the channel, wait for the breakout confirmation.
Channels work well in both trending and ranging markets.
They appear in 3 forms;
- Ascending channel
- Descending channel
- Horizontal channel
Ascending channel
When you draw two trend lines below and above price in an uptrend, you create an ascending channel.
A breakout on the upper line of the channel/resistance gives a signal for a buy while on the lower level/support gives a signal for a sell.
An Ascending channel usually has a bearish bias. Therefore a breakouts on the downside confirming sell entries perform better than upside breakouts.
Let’s take a look at the chart below.

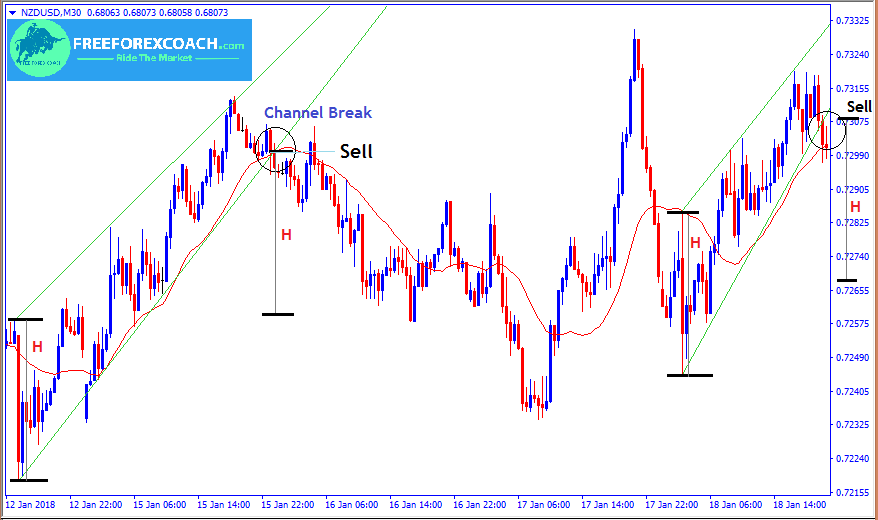
From our NZDUSD, 30 minute chart above,
The confirmation for entry is the bearish candle close below the support trend line.
The profit target is is got by measuring the height (H) of the channel and projecting same distance from the break.
Horizontal channel
This forms when price is moving in a side ways direction.
When ranging,
Draw the support line below and resistance line above hence forming a rectangular pattern.
This means price can break either sides of the channel and can form in any kind of the market.
Usually a horizontal channel has NO bearish or bullish bias.
A break at a resistance level gives a buy signal and at support level gives a sell signal.
UPTREND with Channel
When in an uptrend, a break out at support may lead to a change in direction of the entire trend; trend reversal
A breakout on resistance, signals trend continuation.

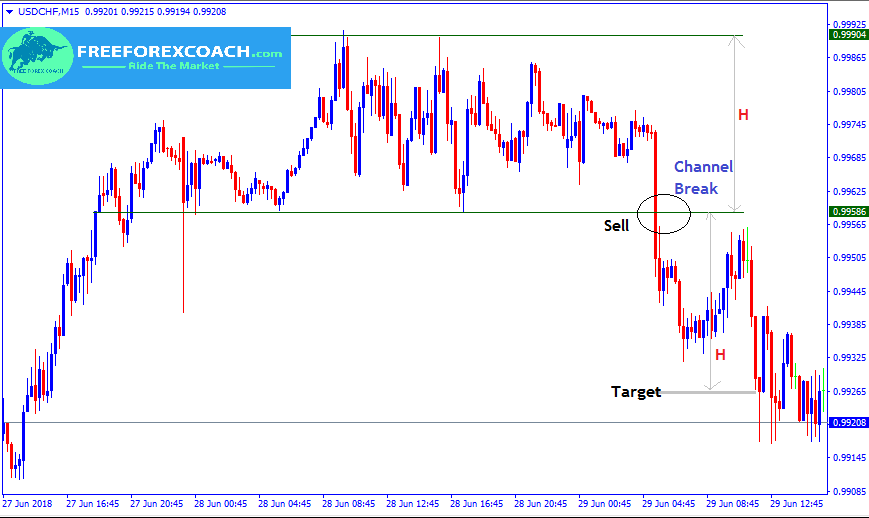
From the above chart,
After a breakout on the support level, price rallied strongly to the down side leading to change in the entire direction of the trend.
The sell entry confirmation is a candle close below support line.
The profit target is got by measuring height (H) of the channel and projecting same distance to the downside.
DOWNTREND with Channel
In downtrend,
Break out on the upper side of horizontal channel signals trend reversal
While a break out on the lower side signals trend continuation.

Therefore a horizontal channel is both a continuation and reversal pattern.
Descending channel
To plot a descending channel, you must have a downtrend.
Draw two parallel falling/descending trend lines on both sides of the price movement.
Price moves in between finding support and resistance on the lower and upper side of the channel.
The Descending Channel usually has bullish bias
A break out is always expected on the upper side of the channel and this may lead to the entire shift of the whole trend.
This gives a strong buy signal.
Let’s take a look at the chart below.

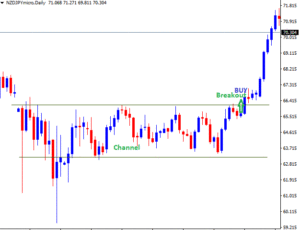
From the chart above,
The confirmation for buy entry is the bullish candle close above the resistance trend line.
The profit target is is got by measuring the height (H) of the channel and projecting same distance from the break to the upside.
HOW TO SET RULES FOR PROFITABLE FOREX AND STOCK TRADING
I have always said and will say it again; Trading is about following your rules, everything else is amateur behavior. Following trading rules is very important if you want to profit from Forex trading and we shall look at reasons why you need to trade your rules. This...
- Oh, bother! No topics were found here.


