
Descending Triangle Pattern in Forex is a bearish chart pattern that usually forms during a down trend as a continuation pattern.
It is the opposite of the ascending triangle pattern
What is a descending triangle pattern in forex.
The descending triangle pattern in forex appears with a sloping trend line and flat support.
Let’s take a look at the illustration below;
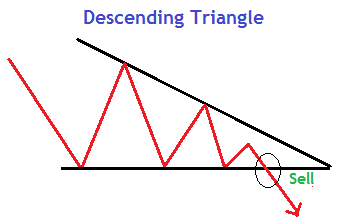
As of the fact,the descending triangle pattern indicates that sellers are more aggressive than buyers as price continues to make lower highs.
Therefore, when it appears in a downtrend, its an indication that prices will continue to fall strongly after the completion of the pattern.
A descending triangle in a downtrend
The pattern is complete when price breaks out of the triangle in the direction of the overall trend.
From the chart above,
The price broke the support line giving us a sell signal. price breakout on the support of a descending triangle in a downtrend is an indication that the trend is still on.
On the other hand,
when a descending triangle breakout on the support when in an uptrend, it confirms a trend reversal . But they are usually continuation patterns in a down trend.
The descending triangle as a trend reversal pattern
In this case,
We see how a descending triangle pattern in forex is a reverse pattern when it appears at the top of an uptrend.
Therefore, get ready to short when the pattern gives confirmation as it breaks the support line.
However, one should always carry this in mind;
Not all the descending triangles will breakout to the downside. You will also see an upside breakout from the descending triangle at some point.
This simply means, you can also trade the pattern on the opposite direction.
In this case, it becomes a reversal pattern when in downtrend and a continuation pattern in an uptrend.
The descending triangle breaking on the opposite direction
From the above chart,
The market gave a fake breakout at the support line and shortly broke the upper trendline.
Now you see why it is important to always set your stop loss levels.
If you had a short position, you would be stopped out shortly after your entry.
It also brings to attention that, this pattern is likely to pose fake signals sometimes. Your stop loss is very important.
How to trade the pattern
Like we said earlier, the descending pattern is common in a downtrend than an uptrend.
Guidelines to Trade Descending Triangle Pattern in Forex
- There must be prior downtrend before the pattern.
- Use the support line and trendline to identify the pattern
- Once you confirm a breakout on the support line with a bearish candlestick below,
- Take a short position.
Alternatively,
You can wait for a price retest at the support after price break and short on the second confirmation.
However, since the triangle patterns give small targets, you are likely to either miss out on trade or chase it in case you consider the second option.
Stop loss and take Profit Levels
The Profit target is got by measuring the height of triangle and projecting that same distance forward from the support.
Stop loss is set slightly above the upper level of the pattern for a sell position.
Let’s look at a practical way trading the Descending triangle pattern on a price chart.
Below is EURAUD, 4-Hour chart with the pattern
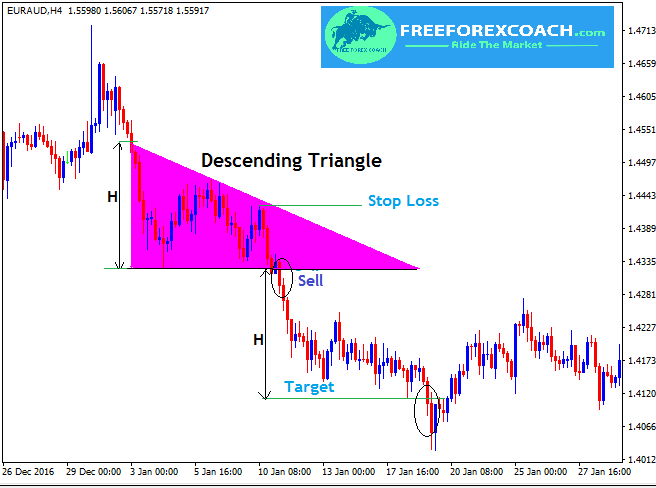
From the above chart,
Entry is indicated with a black circle after the break of the support line.
Target profit H is got by measuring the height of pattern (H) and projecting that same distance (H) down.
Also,stop loss is set slightly above the upper level of the pattern.
Suppose price breaks to the opposite side, follow the same procedure to set stop loss and the target profit.
In summary
- The descending triangle has a flat support level with the upper side sloping downwards as the price makes lower highs
- It is a bearish chart pattern that usually forms during a down trend as a continuation pattern
- However, to a smaller extent, a descending triangle pattern will sometimes form as a reversal pattern as an uptrend comes to an end. Hence bearish reversal pattern.
- The break and close of the candle below the support line gives a confirmation sell signal for a continuation in the down-trend.
- The profit target is the same distance as the height of the triangle.
Last but not least, not all the time will price breakout the support level.
it can also breakout in the opposite direction on the sloping trend line. Always use a Stop loss

How Does Greed Impact your Forex Trading Success?
There are several ways greed can impact your Forex trading success. Firstly, greed can make you abandon your well crafted trading strategy in favor of impulsive and speculative actions. Instead of adhering to predetermined entry and exit points based on technical or...
-
- Topic
- Voices
- Last Post
-
-
Trading preparation routine!
Started by:
in: Trading Discussions
- 1
- 4 years, 8 months ago
-
Consistency in Trading
Started by:
in: Trading Discussions
- 2
- 5 years, 2 months ago
-
Consistency and Trading Discipline
Started by:
in: Community
- 1
- 5 years, 3 months ago
-
choosing a broker to deal with for forex trading
Started by:
in: Broker
- 4
- 5 years, 4 months ago
-
Strategies for Profiting on Every Trade – Oliver Velez
Started by:
- 1
- 5 years, 5 months ago
-
Setting Stop Loss and Take Profit Levels.
Started by:
- 4
- 5 years, 5 months ago
-
cutting losses
Started by:
- 3
- 5 years, 5 months ago
-
Trading a real account
Started by:
in: Beginner’s Questions
- 6
- 5 years, 7 months ago
-
How to determine forex quotes
Started by:
in: Beginner’s Questions
- 3
- 5 years, 7 months ago
-
Forex trading
Started by:
- 4
- 5 years, 7 months ago
-
What is forex trading
Started by:
- 4
- 5 years, 9 months ago
-
What are the best indicators of trend direction?
Started by:
in: Trading Discussions
- 2
- 5 years, 9 months ago
-
Good time to trade
Started by:
- 4
- 5 years, 11 months ago
-
Forex trading
Started by:
- 3
- 5 years, 11 months ago
-
Forex Trading
Started by:
- 1
- 5 years, 11 months ago
-
Forex Trading.
Started by:
- 2
- 6 years ago
-
Forex Brokers That Offer Crypto currencies
Started by:
- 2
- 6 years, 2 months ago
-
Ernst & Young's Financial Planning Essentials
Started by:
- 1
- 6 years, 3 months ago
-
Trading preparation routine!

