Flag pattern in forex forms when price consolidates after a sharp move in a trend. They are relatively small and are traded for small quick profits.
They are called flags because they are in shape of a flag.
What is a flag pattern in forex
A flag pattern in forex is a continuation pattern that appears as a small consolidation before the trend continues. It can form both in an uptrend and downtrend as a bullish flag or bearish flag.
The pattern resembles a flag. It is a small rectangle consolidation connected to the pole, the prior move before the pattern.
The two parallel trend lines defining a flag move in the opposite direction of the initial sharp movement.
The trend lines act as support and resistance levels.
A bullish flag chart pattern
A bullish Flag pattern in forex forms during an uptrend trend.
The pattern starts with a strong trending move upwards followed by a weak pullback of small candlesticks. During the consolidation phase, the tops and the bottoms create a parallel channel.
Example of a bullish flag;
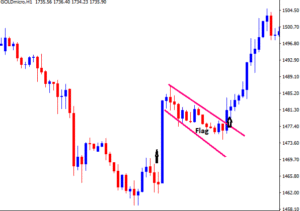
A strong price break in the same direction of the initial trend (upside) gives a signal for trend continuation.
The buy signal is the close of the confirmation candle above the upper slopping line.
To set your target profit, measure the distance moved by price before formation of the flag or the flag pole.
Also, set your stop-loss slightly below your entry point.
Take a look at the chart below;
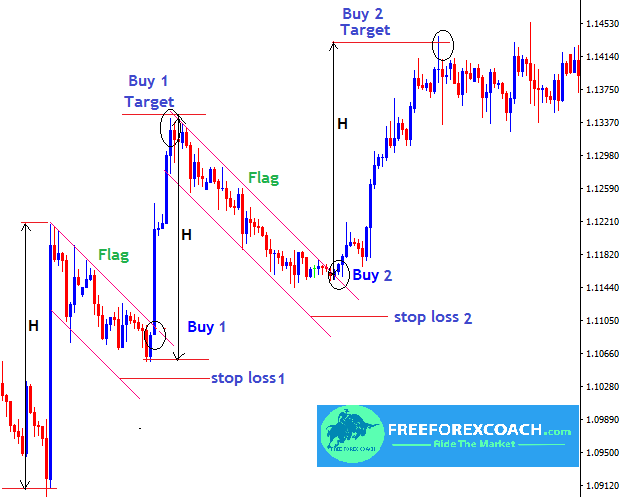
From the chart above,
We have Buy signals 1 & 2 respectively following the confirmations after the breakout on upper trend line.
The profit target is equal to the distance moved by price before the formation of the flag (H) or the flag pole.
Stop-loss is set slightly below your entry point as indicated on the above chart.
Bearish flag
A bearish Flag pattern in forex forms during a downtrend trend.
Like the bullish pattern, a bearish pattern also starts with a strong trending move downwards followed by a weak pullback of small candlesticks.
The bearish flag is the opposite of a bullish pattern in forex.
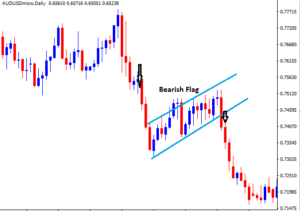
In this case,you can see a strong price movement in a downtrend before formation of the pattern.
The bearish flag pattern in forex forms moving up to the opposite direction of the trend movement. In addition,the trend lines act as price support and resistance.
A strong price break on the lower trend line signals a probable downtrend continuation.
You can Sell/short when price breaks the lower rising trend line of the flag.
Set your stop-loss slightly above the entry position.
For the target profit, measure the height of the flag pole and project it downwards after the breakout.
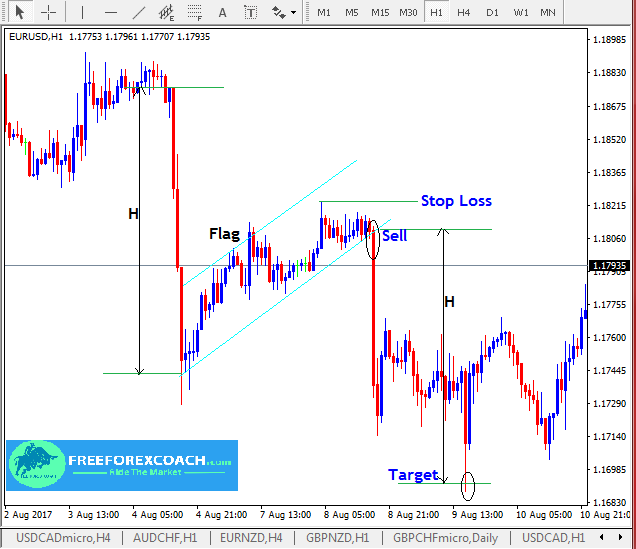
Let’s take a look at the EURUSD, Hourly chart below;
Flags are easy to trade.
Notice on the chart above,
Sell entry is when price breaks the lower rising trend line of the flag.
The stop-loss slightly above the entry position.
While the target profit level is equal to the size of the flag pole (H).
HOW TO SET RULES FOR PROFITABLE FOREX AND STOCK TRADING
I have always said and will say it again; Trading is about following your rules, everything else is amateur behavior. Following trading rules is very important if you want to profit from Forex trading and we shall look at reasons why you need to trade your rules. This...
- Oh, bother! No topics were found here.

