
Bollinger Bands Strategy in forex is a market Volatility Strategy. Bollinger bands are technical market indicators traders use to measure this volatility. They were developed by John Bollinger.
This indicator comprises of 3 lines;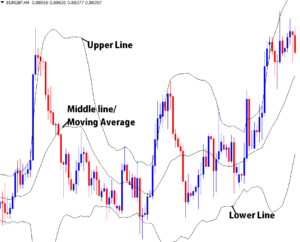
- The upper line above the price,
- A moving average in the middle
- The lower line below the price.
The lower and the upper bands form a channel with a moving average running between.
The moving average line runs in the middle of the band and is normally/default set at 20 period and the 2 lines of the band are plotted 2 standard deviations above and below the moving average(middle line).
We shall use the above default settings in the examples below but you can adjust these values to suit your needs.
The bands widen when the market volatility increases (noisy) and tend to contract when it falls (quiet).
As of the fact, the Bollinger bands strategy in forex works well in both trending and ranging markets.
To make things quit easy for you, you may look at the bands as support and resistance or a channel.
The bands always hold prices in between, the upper band as a resistance and the lower band as support.
Bollinger bands strategy in forex trending market
When price is moving along the upper band, it’s a signal for a strong uptrend.
Similarly, when price moves along the lower band, it is a signal for a strong downtrend.
A pull back on either of the bands, is an indication for a fall in price momentum.
Bollinger bands strategy in forex helps to assess how strongly prices are rising (uptrend) or falling in a downtrend, and when losing strength.
As a trader, you can use this information make trading decisions.
Let’s look at this in more details
How to trade bollinger bands strategy in an uptrend
When the price is in a strong uptrend it run along the upper band following the trend direction.
When it falls back towards the center moving averages/pulls back, it shows the uptrend may be losing momentum.
However, price does not move in a single direction all the time. Therefore, even during an uptrend prices may drop for periods of time or pullback.
This is what you wait for; A pullback to the middle line.
Take a look at the chart below;
Since we are in a trending market, better trade in the trend direction. Its better way to trade the bollinger bands strategy in forex trending market.
Notably, When the price is in a strong uptrend it shouldn’t break the upper band. If this happens, it is a warning sign of a reversal. Usually a short term reversal if the market is trending.
How to trade bollinger bands in a downtrend?
Price in a strong downtrend runs along the lower band following the trend direction.
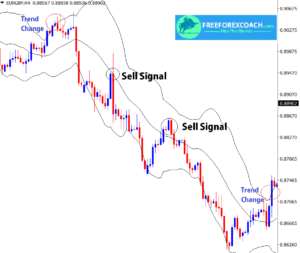
Wait for price to rise up towards the centre moving averages/pulls back, to trade in trend direction.Even during a strong downtrend, expect prices to pullback for periods of time.
As of the fact, using bollinger bands strategy in forex for entry points is a bit challenging.
You are likely to fall trap of fake signals if not careful since it just measures price volatility.
To avoid that, you should combine it with other indicators to generate stronger signal confirmations. For instance, you can use bollinger bands with reversal candlesticks patterns or support and resistance.
Let us see an example below;
Bollinger bands strategy with candlestick patterns.

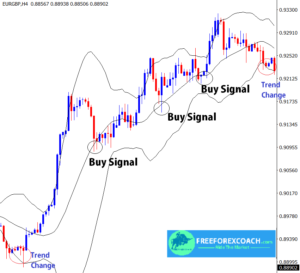
From the above chart, we are trading following the main trend direction. In this case, we are mainly concentrating on reversal candlestick patterns on the middle line(moving average).
Signals confirmed by Candlestick Patterns
Buy 1 & 2( bullish engulfing pattern), Sell 1 (bearish engulfing pattern), and sell 2 (doji+bearish engulfing pattern).
Trend Change
When price touches the lower band after a long uptrend move, at A ,this may be a sign for change in the direction trend. The reverse is true for a downtrend.
Price touching the upper band after a long downtrend move, at B ,this may be a sign for change in the direction trend. So we start looking for buy signals from pullbacks
This is very important to consider when trading trending markets using Bollinger bands. The warning calls for you to exit trade or prepare for a new entry.
Also when trading in a trending market, and the bands expand, it indicates increase in volatility.
In this case, you expect to use larger stop loss levels so as to cater for the big price movements.
How to use Bollinger bands strategy in forex ranging market
In the ranging markets, price moves along the upper line and the lower line of the bands.
It tends find the support and resistance levels. Therefore these lines can be treated as dynamic levels of support and resistance. This is what you capitalize on
Sell and Buy Signals;
Sell when price bounces off the upper line/band. Or else, Buy when price bounces off the Lower band. Reversal candle stick pattern on the upper or lower band would be an added strength to the signal.
For a sell signal, put your stop loss slightly above the upper band. Whereas for a Buy signal, put your stop loss slightly below the lower band.
The take profit levels are on the upper and lower band for sell and buy respectively.

Remember,when trading this strategy, you have to watch price behavior at the middle line(moving average) because it tend to pull back or reverse at this level.
In case, you notice the appearance of any reversal candlestick patterns at this level, it may be a signal for change in price direction. Prepare to exit trade instead of waiting to hit the outer bands
Bollinger bands squeeze and Breakout
You can also take advantage of a breakout on bands squeeze in the ranging market environment. The Bollinger bands squeeze and break out is one of the most rewarding Bollinger bands Strategy in Forex
Bollinger Bands squeeze is an indication for very low volatility. These are zones of congestion so usually result to strong price breakout either on the upper side or lower side of the bands.
As a result, you are likely to have a reversal /change in trend direction.
Signals and Trade management
- If price breaks the upper band, there is a possible uptrend hence a buy signal.
- On a break of a lower band it signals a down trend, sell signal.
- Set Stop loss on the side of the congestion.
- Common Profit targets are when price comes back to the middle band.
Yes, you may close up some profit when this happens as you wait for the next band squeeze opportunity.
On the chart below, the highlighted zones, are the band contractions as a result of price congestion.

The above chart shows how to trade break outs on dynamic resistances using bollinger bands.
You can also add, reversal candlestick patterns or horizontal support and resistance for stronger signal confirmation. This protects you from several fake outs.

How procrastination can affect your trading success?
Procrastination to trade is when your trading set up confirms and you hesitate to take trade. Or your trade show all failing signals and you hesitate to close trade to cut losses. Also, in cases, where you sometimes hesitate to take profit because you want to...
- Oh, bother! No topics were found here.

