
MACD Indicator is a Moving Average Convergence Divergences indicator.
It was developed by Gerald Appel to detect swings in price of financial instruments.
Most traders use the MACD to identify reversal points in a trend and for trend confirmations.
The MACD detects momentum changes and signals over bought and over sold conditions.
The MACD indicator comprises of 2 parameters;
- MACD line
- Signal line
MACD line is the difference between the 26 period & 12 period of Exponential moving average and the signal line which is the 9 period exponential moving average of the MACD.
On Metatrader 4, the default MACD doesn’t have the main MACD line, it is represented by a Histogram(bars).
The histogram = MACD line – Signal line
When the MACD crosses the signal line and the histogram crosses the zero line, this gives a signal that a trend is likely to change.
In addition, if the MACD is above the zero line, prices are trending higher.
Whereas, if it is below prices are falling.
How MACD Indicator looks on a chart.
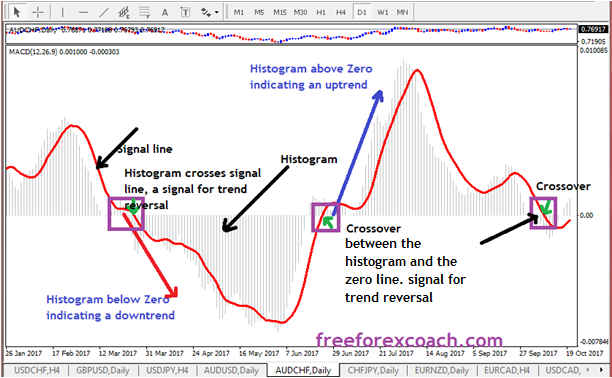
When the faster moving average moves away from the slower moving average, the MACD shows their relationship which is the divergence.
On the other hand, when the faster moving average gets closer to the slower moving average the histogram becomes smaller showing their relationship (convergence).
This is the divergence and convergence but on the chart above, it is combined in the histogram so is not visibly clear. We will look at this later.
How to trade using MACD
One way to trade using a MACD indicator is by looking at the MACD movements. This is the simplest way to look at the MACD Indicator
When the MACD histogram is above the zero line, it’s an indication of an uptrend, when it goes below it indicates a down trend.
You can buy or sell at the shift of the MACD histogram above or below the zero line.
Entry signals are when the MACD histogram and the signal line cross above/below Zero.
Take a look at the Gold Chart below;
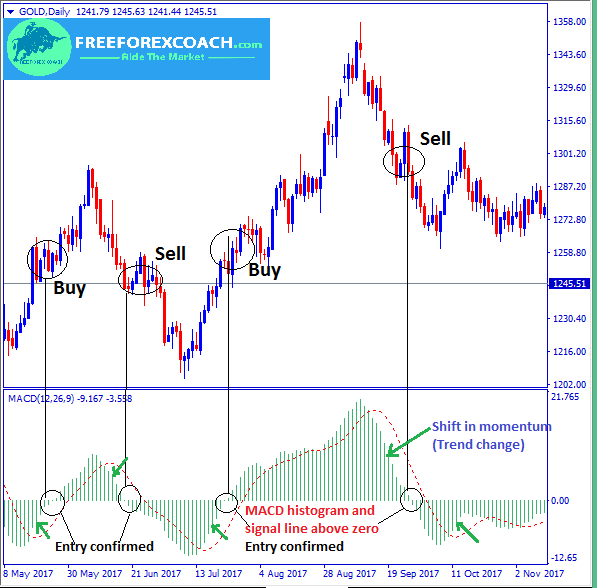
According to the chart above,
When the MACD histogram crosses above or below the signal line, it gives a signal for a strong trend.
The signal line is the broken red line running through the MACD histogram.
As the histogram moves away from the signal line, it shows fall in momentum. When this happens, prepare for a change in trend direction.
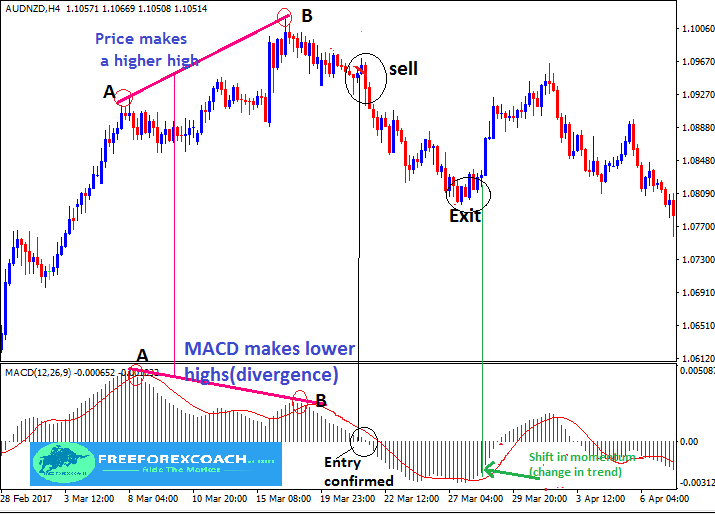
Trading MACD divergencies
The MACD indicator is also used to identify possible reversal signals in form of the bullish divergences and bearish divergences.
To trade divergence using the MACD, you have to concentrate on price movement adjustments and the MACD histogram.
That is when price makes a new swing high or a new swing low, but the MACD histogram does not. When this happens, it indicates a divergence between price and momentum.
Most traders use the MACD histogram – price divergences for both trade entry and trade exit signals.
For instance,
When market prices forms the lower low of the previous low and the MACD forms the higher low of the previous low. This indicates bullish divergence.
This can result to a trend reversal(bullish reversal).
You can take a Buy position when you get confirmation.
Likewise,
When the market price makes a higher high of the previous high and the MACD makes a lower high of the previous high (bearish divergence) then the high is fake. That is a bearish divergence.
Probable signal for a bearish reversal. Well, this says it’s time to sell.
Divergence is more valid when it forms after a sharp price movement higher or lower.
The example below explains a bearish divergence between a MACD and price movement.
MACD Divergence on a Chart
 `
`
From the chart above,
Price and MACD make highs at A.
Later on, at B, price made a higher high and MACD made a lower high, that is a confirmed bearish divergence.
Entry signal is when the histogram and the Signal move below the 0.00 line as shown on the chart above.

How Does Greed Impact your Forex Trading Success?
There are several ways greed can impact your Forex trading success. Firstly, greed can make you abandon your well crafted trading strategy in favor of impulsive and speculative actions. Instead of adhering to predetermined entry and exit points based on technical or...
-
- Topic
- Voices
- Last Post
-
-
Trading preparation routine!
Started by:
in: Trading Discussions
- 1
- 4 years, 8 months ago
-
Consistency in Trading
Started by:
in: Trading Discussions
- 2
- 5 years, 3 months ago
-
Consistency and Trading Discipline
Started by:
in: Community
- 1
- 5 years, 3 months ago
-
choosing a broker to deal with for forex trading
Started by:
in: Broker
- 4
- 5 years, 4 months ago
-
Strategies for Profiting on Every Trade – Oliver Velez
Started by:
- 1
- 5 years, 5 months ago
-
Setting Stop Loss and Take Profit Levels.
Started by:
- 4
- 5 years, 5 months ago
-
cutting losses
Started by:
- 3
- 5 years, 5 months ago
-
Trading a real account
Started by:
in: Beginner’s Questions
- 6
- 5 years, 7 months ago
-
How to determine forex quotes
Started by:
in: Beginner’s Questions
- 3
- 5 years, 7 months ago
-
Forex trading
Started by:
- 4
- 5 years, 7 months ago
-
What is forex trading
Started by:
- 4
- 5 years, 9 months ago
-
What are the best indicators of trend direction?
Started by:
in: Trading Discussions
- 2
- 5 years, 9 months ago
-
Good time to trade
Started by:
- 4
- 5 years, 11 months ago
-
Forex trading
Started by:
- 3
- 5 years, 11 months ago
-
Forex Trading
Started by:
- 1
- 5 years, 11 months ago
-
Forex Trading.
Started by:
- 2
- 6 years ago
-
Forex Brokers That Offer Crypto currencies
Started by:
- 2
- 6 years, 2 months ago
-
Ernst & Young's Financial Planning Essentials
Started by:
- 1
- 6 years, 3 months ago
-
Trading preparation routine!

