To trade Parabolic SAR indicator in forex, you must know how to read it. Parabolic SAR Indicator shows potential reversal zones. It was developed by J.Wells Wilder in 1978. He also developed RSI, ATR and ADX.
Unlike these other indicators, the parabolic SAR,can tell you that the trend is likely to end. It is a stop and reverse indicator.
It is a trend following indicator in form of parabolic dots. It moves below the price when in an uptrend and above the price for a downtrend.
As the dots get closer to price, it indicate a potential reversal points in price movement. On the other hand, when the dots move far from price, it indicates a strong trend a head.
SAR stands for “ Stop And Reverse.”
Like the name suggests, it stops and reverses when trend reverses or breaks below or above the it.
How to trade parabolic SAR indicator.
Trading using this indicator is quite easy. You just need to know how to interpret the dots.
Guidelines to trade Parabolic SAR Indicator
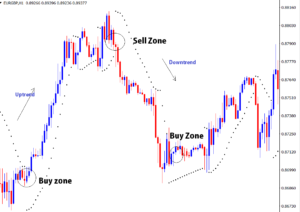
Take a look at the chart below

- When the dots cross to the upper side of the price, that’s an indication for a bearish reversal. This gives you a sell signal. Sell
- If the dots cross to the lower side of the price, its an indication that the trend is likely to reverse upwards giving a buy signal. Buy
- Buy when the dots are below the price movement and sell when above.
how to use parabolic sar indicator to exit trades
You can trade Parabolic SAR indicator as your exit levels. As the indicator show signs of change in trend direction you can prepare to exit position.
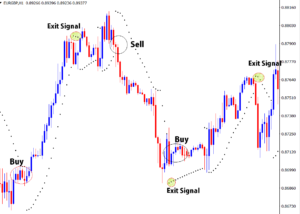
Take a look at the chart below;

Exit a buy trade when 3 dots cross to the upper side of the price movement. Exit sell position when 3 dots cross to the down side of the price movement.
Appearance of dots on the opposite side indicates a possible slow down/ change in trend.
So wait for atleast 3 dots so that you don’t exit too early.
how to trade parabolic SAR with Support & Resistance.
Parabolic SAR works better in trending markets. Trending markets have levels of pauses/ congestions. These zones are usually what gives support and resistance zones.
SAR will have short bursts/ breaks in ranges/congestions. But will indicate the trend direction before the break out. This gives you extra confirmation on the break out for an entry signal.
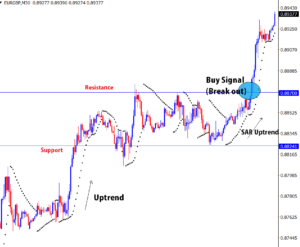
Take a look at the chart below.

We had an uptrend that went into a congestion as indicated on the chart above.
The congestion gives the support and resistance levels.
You can see before the break out signal, the Parabolic SAR indicator already shows uptrend.
That is an extra confirmation for the buy signal.
Exit signal is when you get 3 dots on the other side of the price, in this case, you would still be running in profits.
conclusion
Parabolic SAR indicator moves near the price trend it gaps above or below the price following a change in the price direction.
Dots are below the prices during an uptrend and above when its a downtrend.
As it stops to reverse, we see a change in the movement of the dots before and immediately after changing direction.
The dots get closer detecting a probable change in trend direction or as a sign of congestion on the market chart.
The stop and reverse indicator crosses over, gaping to the upper side if price has been in an uptrend signaling a down reversal.
The opposite is true when price is a downtrend. The dots cross to the downer side signaling a coming uptrend.
Parabolic SAR Indiactor is more choppy and gives so many false signals in a ranging market. It works better in trending markets than ranging markets.
ATTRIBUTES OF A SUCCESSFUL TRADER
As i had promised to discuss the attributes of a successful forex trader. These are the most important of all. It's as simple as understanding the mechanisms of a predator. What hurts new traders is that they can not distinguish between facts and opinions and they end...
- Oh, bother! No topics were found here.


