Forex Candlesticks structure appears in different shapes and sizes and this determines the degree of their strength on the forex market charts. Let’s have look at their interesting sizes below.
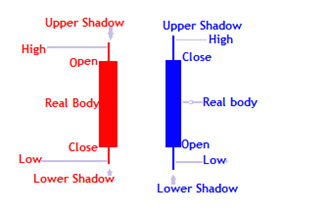
The Japanese forex candlesticks structure is composed of the open, high, low, body and close.
See illustration below; (Blue – Buyers/Bulls) ( Red – Sellers/Bears)

let’s first look at the Open and the Close.
Open and Close of forex candlesticks
When the close is higher than the open, it is a bullish candlestick whereas when the close is lower than the open, it forms a bearish candlestick.
The bullish candlestick opens below the body and closes above the body. On the other hand, the bearish candlestick opens above the body and closes below the body.
The open price is the first price traded in each time frame and the close price is the last price traded.
The Candlestick Body
Candlesticks may appear as full body, no highs and lows, large body with highs and lows, small body or no body at all.
The bodies of candlesticks represent market participants depending on the color; both buyers and sellers in the market.
The long body forex candlesticks structure
Long bodies display the pressure of traders in the market.
The bigger the real body, the more buying or selling pressure.
When you see a long blue candlestick, the bulls are stronger than the bears and they dominate the market. On the other hand, when a long red candlestick appears, its the sellers/ bears in charge of the market.
Long red real body candlesticks show stronger pressure of sellers over the buyers in the market. Prices then further close below the opening. As more sellers enter the market, price continue to fall due to increase in supply over demand hence further close of price below the open.
Long blue real body candlestick structures signify that the buyers are in charge of the market and further close above the opening. This means more buyers are in the market hence high price increase.
This normally happens when there is strong volatility(large price movements) in the market.
The small real body
As the real body becomes smaller, war between the bears and bulls becomes very tight.
The buyers and sellers almost have the equal strength.
Whoever becomes stronger takes charge of the market. This may lead to change of a market trend.
In addition,the continuous decrease in size of a real body of a candle may lead to the formation of a Doji candlestick. The doji’s open is equal to the close. This simply means, it has no real body.
The formation of small body candlesticks is a strong sign of indecision between the buyers and the sellers in the market.
Price Volatility is low and the market is almost in no specific direction at all.
The candlestick shadows
The shadows are below the open and close of a candlestick. They also appear in different sizes.
The long shadows and the small shadows
Long shadows
The long upper shadows show that high prices have been rejected in the market.
More buyers in the market push prices high and sellers for some reasons come to the market unexpectedly and push prices back down and close near the open. This for example can happen when some traders sell off there long positions or just new sellers coming to the market in that same time frame.
For the long low shadows, it shows that low prices have been rejected.
This happens when sellers are dominating the market and surprisingly buyers appear with a lot of strength for any reason forcing prices up to close near the open.
At this point, prices are so low that seller cannot sell further. Meanwhile some of the buyers come to the market to take advantage buying at very low prices.
Like any other normal market, when demand increases, prices following with an increase.
In the same way, as more buyers get to the forex market, currency price will appreciate pushing prices from its lower low to the close of the candlestick.
Small/short shadows
The short candlestick shadows show small price rejections in the market.
This means that either buyers or sellers are still strong and are likely to dominate the market for a while.
If it is an uptrend/ price is moving up, it means buyers still have higher chances to dominate the market for a while. Likewise, if it is a downtrend(price falling), the sellers are still strong and will drive the market for a while.
However, this does not mean that sellers/buyers will not appear at all for an uptrend and buyers for a downtrend.
Forex Candlesticks structure with no shadows
Some candlesticks appear with no shadows at all.
These form when the open equals to high and the close equals to low for the red/bear candlestick. Or, the open equals to low and close equals to low for the blue/bullish candlestick.
When this happens , it means that either the buyers or sellers are in control of the market from the first trade to the last trade for the whole session.
They are known as; Marubozu. We shall discuss more as we go through the candlestick patterns below.
Common mistakes most traders make and how to avoid them?
Fear and greed are the number one causes for the common mistakes most traders make when trading. Fear and greed normally come before trading, during and after trading. When you are under fear or greed, you are likely to commit these mistakes most traders make; Get...
- Oh, bother! No topics were found here.


