
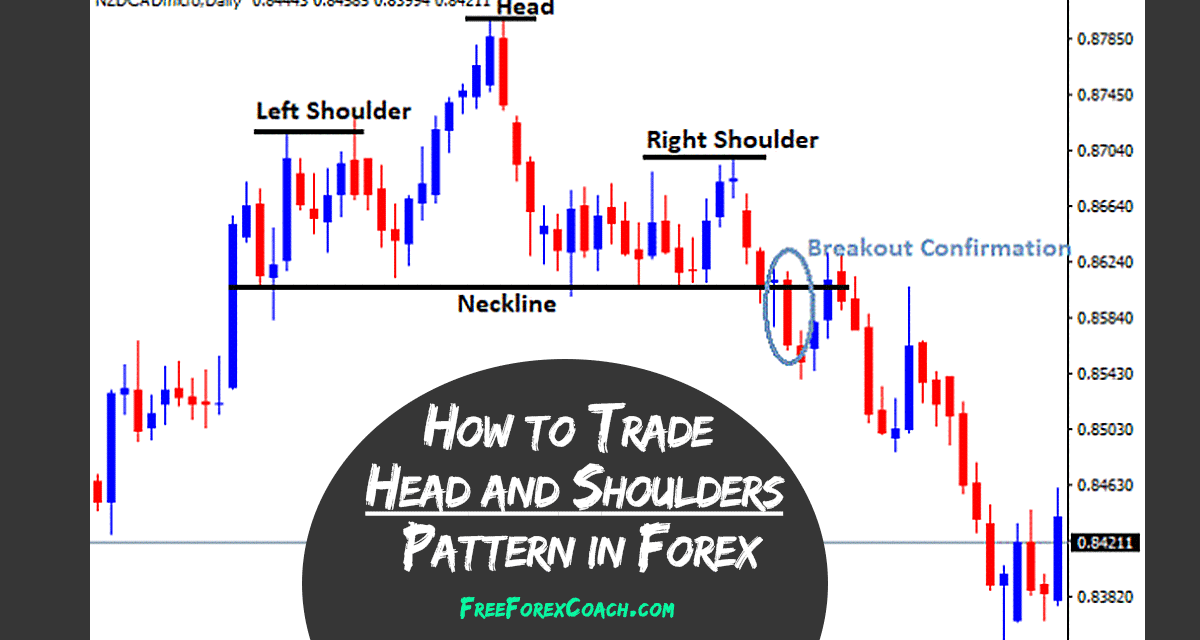
The Head and Shoulders pattern Strategy is one of my favorite reversal patterns to trade. It is one of the most reliable chart patterns, having accuracy of almost 90% and generating profits for decades.
This pattern is one of the most recognized of all chart patterns.
It does not take a seasoned trading eye to spot one forming on a chart. They don’t come around often but when they do the profits can be considerable.
The head and shoulders pattern strategy can develop over virtually on any time-frame. This is one of the major reasons why this pattern has potential to make you profits every single day
Questions I often get are about entries, objective exits and Stop losses. But don’t worry now. I am going to show you everything you need to know to make money from this reversal pattern.
Great, let’s get started.
What is a Head & Shoulders pattern?
The best question would be, What really qualifies as a head & shoulders?
Let’s begin with the illustration below;
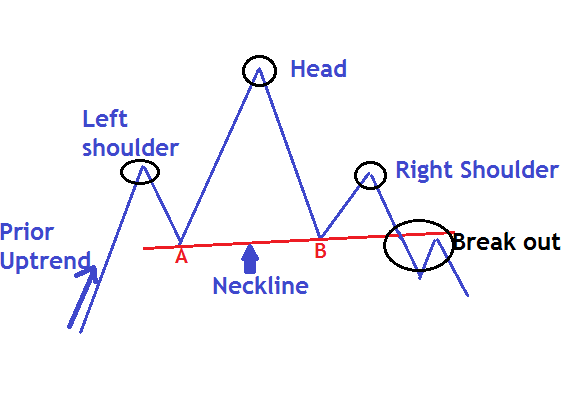
From the above illustration, there are 5 components of a Head and Shoulders pattern strategy that must be present in order to confirm the pattern has formed.
- Prior uptrend
- Right shoulder
- Head
- Left shoulder
- Neckline
We will look at each part individually, and then later put them together with some examples.
Step 1: Prior Uptrend
This is the very first part. There must be a clear prior uptrend.
As a general rule, the longer the uptrend lasts, the stronger the reversal is likely to be.
Step 2: Left shoulder
At this point, the market moves down to form a higher low. This gives a peak which is the left shoulder. But at this point there isn’t anything substantial to confirm the pattern
Step 3: Head
From the low of the left shoulder, the market advances and makes a higher high which marks the top of the head. It then moves down and forms another low. This completes the head structure
At this point, we have the left shoulder and the head of the structure. The pattern is now starting take shape.
Step 4: Right shoulder
The advance from the low of the head forms the right shoulder. This peak is lower than the head (a lower high). You can’t have a shoulder higher the head, right?
At this point the pattern structure is clear.
But one main part missing: The Neckline
Step 5: Neckline:
This level will become a key component when we get into how to trade the breakout. The neckline is drawn by connecting low points A and B.
Low point A marks the end of the left shoulder and the beginning of the head. Low point B marks the end of the head and the beginning of the right shoulder.
Typically the neckline is not horizontal
Psychology behind the head & shoulders pattern (Why does it form?)
The psychology in every pattern is a shift in strength between the buyers and the sellers. In the head and shoulders, the buyers are tiring. That simply means we are having a shift in strength from buyers to sellers.
OK! That must be a bit confusing! Let’s explain more.
Head and shoulders Pattern Strategy Explained
The prior uptrend indicates a lot of strength in the buyers, pushing prices higher. As the buyers are tiring, there is a general shift of strength from the buyers to the sellers. At this point, prices start to fall as more sellers come in. this is how to the left shoulder gets to be formed.
On the low of the left shoulder, we have more buyers who are not yet convinced of the falling prices and actually take advantage of falling prices to even buy more. This leads to prices pushing even much higher to form the tip of the head.
At this point, most of the buyers exit their positions and this causes a lot of panic selling that completes the head structure. So if you just bought at the tip of the head, you would now get trapped.
Actually, the head is basically a ‘bull trap’
At the low of the head, a few buyers come in to take advantage of the low prices. This causes a slight rise in the prices up to the tip of the right shoulder. Remember we are having very few buyers in the market this time. That’s why the tip of the right shoulder is actually lower than the tip of the head.
So the right shoulder is fully formed when almost all the remaining buyers exit positions and now more sellers enter the market pushing prices lower.
Now we are at the point where we are in the neckline zone, waiting for the break out.
Sit back and relax now. We are getting to the one the important parts; THE BREAKOUT!
Head & shoulders breakout
We need to start by knowing what qualifies as an actual breakout. An actual break out is when the candle closes below the neckline and I mean close below the neckline, not just the tail touching.
Now that we know what an actual breakout looks like, let us see how to enter trades following the head and shoulder pattern.
How to make entries on a head & shoulders breakout.
Now this is really the fun part – how to trade and of course profit from a head & shoulders reversal.
There are two major ways how you can enter a trade on a header and shoulders breakout; An aggressive entry and a Conservative entry.
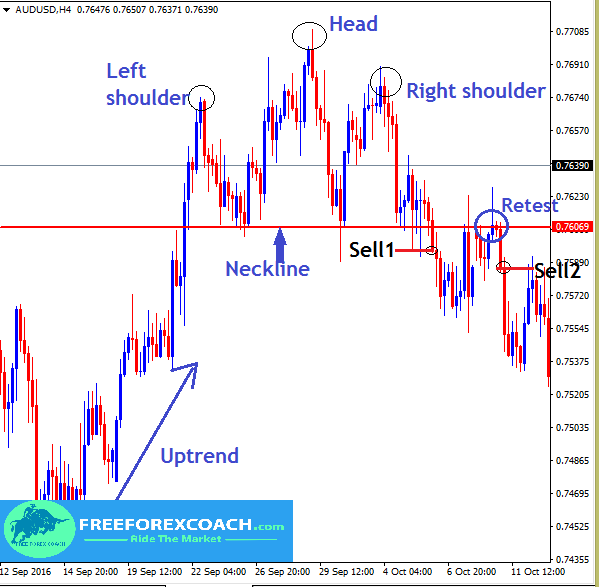
Let’s look at the USDJPY, 4-hourly chart below
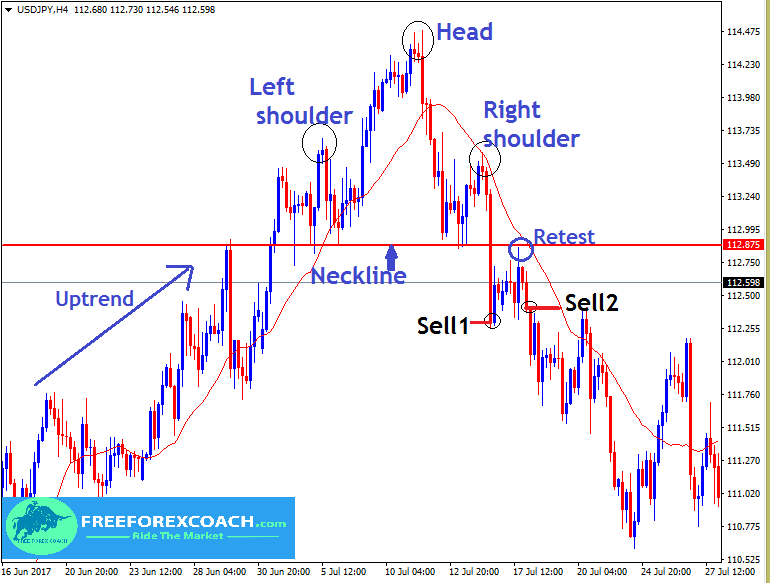
An aggressive entry (sell 1)
An aggressive way to enter the head and shoulders is to enter as soon as the candle breaks through and closes below the neckline. Just as shown at Sell 1 entry
A conservative entry (sell 2)
A more conservative way of trading the neckline break is to wait until the price has broken through the neckline and then retested from the other side as resistance. Just as shown on Sell 2 entry
This is based on the fact that a broken support becomes new resistance and vice versa. So when the candle closes below the neckline. Wait for the price to come back to the neckline for a retest and find resistance, then you can enter a sell position.
Waiting for a retest accomplishes two things:
- It helps validate the recent break
- It offers a more favourable risk reward ratio
This combination is why I almost always opt for the conservative method. There is, of course, a greater chance of missing an entry by waiting, but the potential reward for doing so is equally great.
Example 2 on Head and Shoulders Pattern Strategy Breakout
Let’s Take a look at another example on how to make entries on head and shoulders below on the AUDUSD, H4
From our chart below;
- Sell 1- Aggressive entry
- Sell 2- Conservative entry
Setting Stop losses on Head & Shoulders pattern
Let us take look at how to set stop losses and manage our risk while trading the head and shoulders.
There are basically two ways of setting stop losses that I will share with you here. Just like we have conservative and aggressive entries, we can also set our stop losses aggressively or conservatively.
Let’s take a look at the USDJPY,4-Hour chart below;
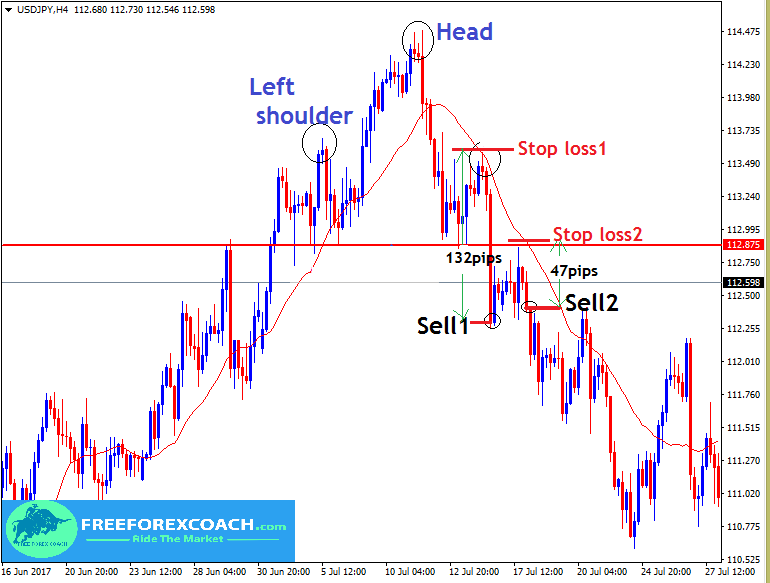
Conservative Stop loss setting (Stop loss 1).
Here you set the stop loss just above the right shoulder. Just as shown on Stop loss 1 on the USDJPY 4-hour chart above
This gives the market enough breathing space between the entry and stop loss but cuts your potential profit in half or worse since the Stop is very wide.
Setting Aggressive Stop Loss (Stop loss 2).
In this case the Stop loss is just set on the previous high as shown above on Stop loss2. I really prefer to use the aggressive stop loss. Simply because it allows for a much better risk to reward ratio while still offering room for price to swing up and down.
Let’s look at AUDUSD chart once again to understand this better.
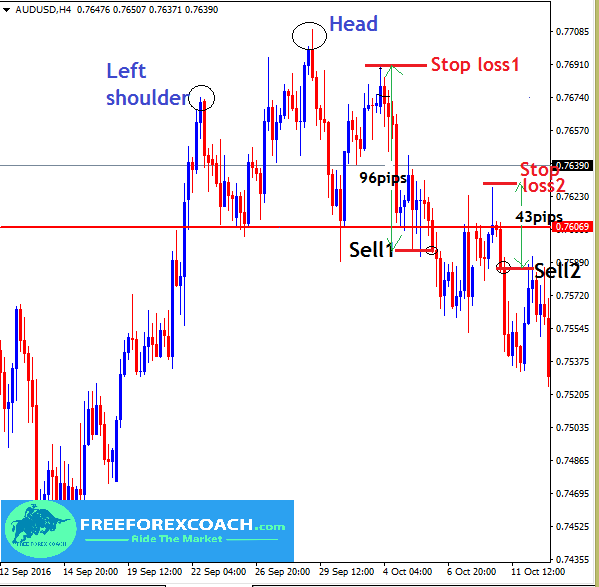
As you can see from our chart, the stop is placed just above the last swing high (stop loss 2). This is still about 43 pips from my entry, so there is still more room for the market to breath, but it isn’t so far away to adversely impact my potential reward.
When you set your stop above the last swing high, you’ve cut your stop loss distance from 96 pips down to 43 pips, yet keeping same target. This earns you more money with a small risk
Setting Profit targets and measured objectives
You’re in business to make profits. A specific profit target can be a powerful catalyst for the growth of your account balance.
For a head and shoulders pattern, the basic method you can use in setting profit targets is the measured objective .This is the traditional way of setting a profit target on the head and shoulders pattern.
Let us look at how exactly this is done.
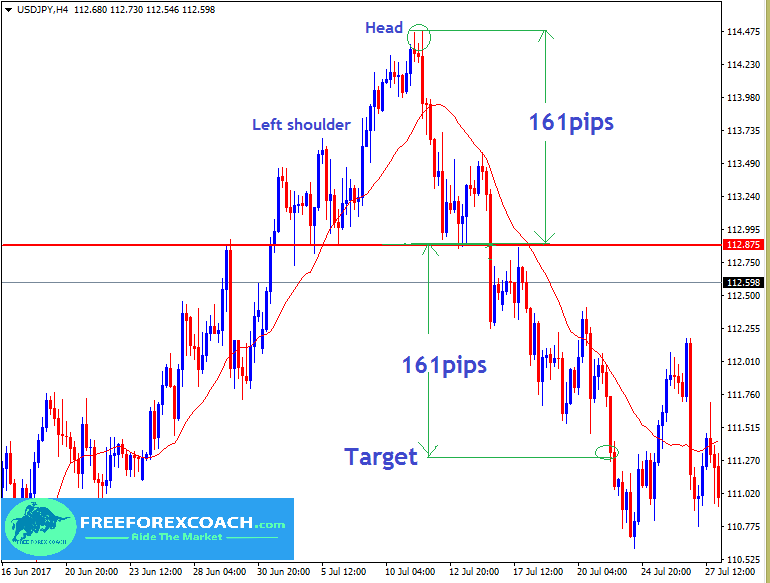
From the example above, note that we measure the vertical distance from the peak of the head to the neckline (161 pips). Then measure this same distance (161pips) down from the neckline beginning at the point where prices penetrate the neckline after the completion of the right shoulder.
This is the same method we used to measure the profit target for our second example on the chart below
AUDUSD, 4-Hour chart ;
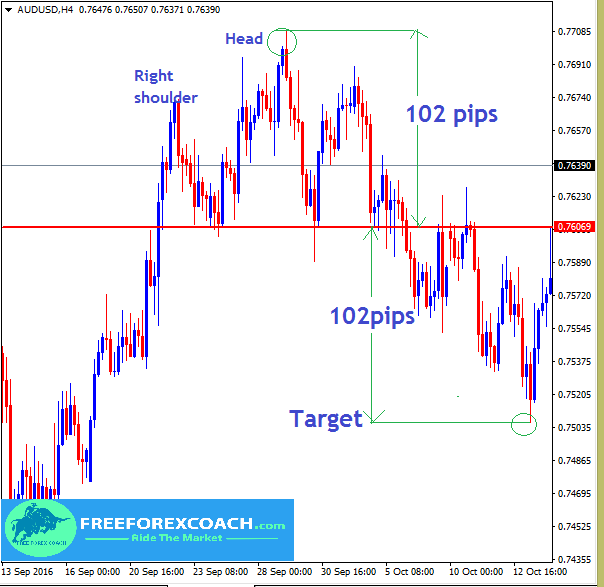
This was 102 pips from the tip of head to the neckline and the same vertical distance to the downside. This gives the minimum objective of how far prices can decline after the completion of this top formation.
Usually this measured target zone corresponds with a key support level. This confluence actually increases the probability of your profit target being hit and therefore gives you greater confidence in your target.
In conclusion, the head and shoulders pattern is very profitable if you follow the basic rules. The pattern appears on all time frames and that’s why it has potential to make you money every single day.


