Previously, we saw different chart trend indicators that you can use for your trade analysis. Namely; ADX, bollinger bands, SAR and the Ichimoku.
We shall now take a small recap on how to use these indicators .
Most of these chart trend indicators are know for giving fake signals especially when used on small time frame or in ranging markets.
However when you combine them with technical analysis indicators, they become more viable.
When used correctly, these indicators are able to tell you the strength, volatility and the direction of the price trend.
Not forgetting that, you can also use these indicators to generate trade signals and to set stops.
How to add chart trend indicators on the chart
From the top tool bar of your platform, look for the indicator list icon.
Click on it. it will display a list of indicators, select trend.
Trend will display another list of trend indicators,
choose the one you want and click on it. A small square will appear on top of your chart, click ok to add.
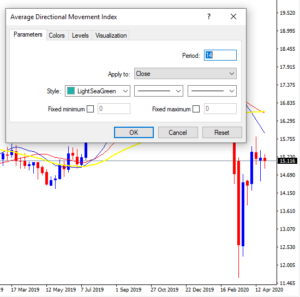 For instance, suppose you need to use ADX indicator,
Click Ok to add the indicator. incase you change your mind, you can click on cancle.
To edit the indicator on the chart or delete;
Right click on the indicator and then select delete indicator or edit under properties.
Make sure the indicator brings the name before you right click
Average directional index ADX
ADX indicator helps to determine the strength of the market trend.
It fluctuates from 0 to 100%. When the reading is below 20, it indicates a weak trend and above 50, it indicates a strong trend.
ADX does not show whether the trend is bullish or bearish therefore it doesn’t give the trend direction, just tell the strength.
Some charts provide ADX indicator with other two indicators that helps traders in determining the direction of trend while others don’t.
It appears with three lines which represent:
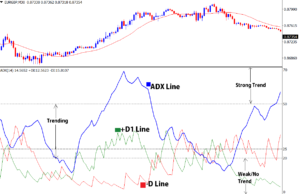
- The ADX line
- The +DI, the positive directional movement indicator that shows uptrend
- The -DI, the negative directional movement indicator shows a downtrend.
When +D line crosses above the –D line and the ADX line is above 50, it indicates the buyers are stronger than the sellers giving you a buy signal.
If the –D line crosses above the +D line and the ADX line is above 50, it indicates that the sellers are stronger than the buyers. Hence sell signal.
If the ADX is below 20, this indicates a weak trend for either the buyers or sellers depending on the positions of the –D or +D line.
The Bollinger Bands – chart trend indicators summary
The Bollinger bands are used to measure market volatility
The indicator comprises of 3 lines following price movement.
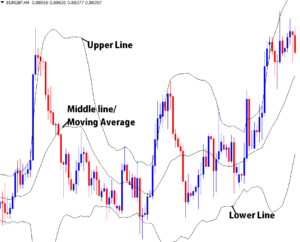
- The lower band below price,
- the upper band above the price
- The Moving Average in between.
When the bands expand, it signals an increase in the market volatility and when they contract it shows a fall in the market volatility.
The two bands act as price channel and can also be used as support and resistance levels to trade. Sell when price bounces off the upper band. Buy when price bounces off the lower band.
Notably, the Bollinger bands work better when trading ranging markets.
When the bands contract, it a signal that price is a approaching its consolidation time or its moving in the sideways direction . As it continues to contract price is likely to beak the band either on the upper side or lower side.
As an aggressive trader, you can also trade breakouts either on the upper or lower band.
The bands are not only used to for entry and exit points but also to set stop and levels . Set targets and stop levels that match the market volitality to avoid premature knock-outs.
High volatility big targets, low volatility close targets from the entry point.
Parabolic SAR (Stops and Reverse)
Like the name suggests, parabolic SAR indicator is used to identify reversal points in a trend.
It is simple and funny. You just have to follow the dots as they follow price movements.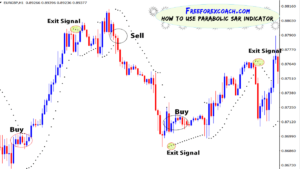
When the dots are above the candlesticks it indicates a downtrend.
if the dots crossover to the opposite side below the candlesticks that gives a signal for a probable trend reversal, giving a buy signal.
If the dots are below the candlesticks, it indicates and upward movements.
When the dots crossover above the price, expect a change in trend direction. This is a sell signal.
You can also set targets and stop levels following the dots crossovers.
Ichimoku kinko hyo (glance at the chart in equilibrium).
Ichimoku Kink Hyo defines future areas of support and resistance, identifies a true trend direction, gauges momentum and provides trading signals.
Just one look on the market chart and you identify the trend and the potential signals with in that trend.
Ichimoku kinko hyo comprises of five plot lines, each in different colors each representing a different role on the chart.
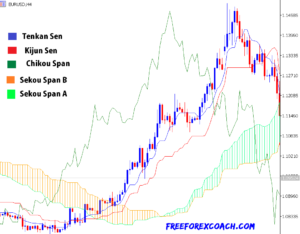 The Tenkan San known as the conversion line in blue,
 - Kinjun Sen (base line) in red,
- Chikou Span in green line,
- Senkou Span A in green dotted
- Senkou span B in orange dotted line.
The senkou spans and the cloud are used to identify the trend direction of the market.
When senkou span A (green) moves above senkou span B(orange) forming a green cloud and price is above the cloud, it signals a strong uptrend hence buy signal.
On the other hand,when the senkou span B moves above senkou span A forming a orange cloud and price moves below the cloud, it signals a strong downtrend, sell signal.
Price moves within the cloud,during consolidation. However, if price breaks out of the cloud it signals a change in trend.
Trading with the Ichimoku Indicators
For bullish signals
- Price moves above the cloud
- The cloud colour turns from orange to green
- The Tenkan Sen crosses above the Kinjun Sen
- Chikou span above the price on the upper side
For bearish signals
- Price moves below the cloud
- The cloud colour changes from green to orange
- The Tenkan Sen crosses below the Kinjun Sen
- Chikou span below the price on the down side
Finally, enjoy your quizz !!. Next we shall look at OSCILLATORS
How procrastination can affect your trading success?
Procrastination to trade is when your trading set up confirms and you hesitate to take trade. Or your trade show all failing signals and you hesitate to close trade to cut losses. Also, in cases, where you sometimes hesitate to take profit because you want to...
- Oh, bother! No topics were found here.


