Harmonic Patterns Summary is short explanation of all major bullish and bearish harmonic patterns.
Just like any other chart pattern, they are used to identify price trend direction and to generate trade signals.
In the previous lessons, we discussed what Harmonic Patterns are? how they form and how to trade them.
Therefore, I suppose by now you have a particular pattern you want to trade from the harmonic class.

The Harmonic patterns are combined with Fibonacci retracement and expansion levels.
Why the fibonacci retracement and expansion
Fibonacci helps to identify possible retracements of recent trends and show areas of continuations of the overall trend.
Also, the Fibonacci numbers help to define accurate trading points and profit targets.
Traders apply Fibonacci ratios to the patterns and try to predict future price movements.
The different forex harmonic patterns
- The A-B-C-D pattern
- The Three drive pattern
- The Gartley pattern
- The Butterfly pattern
- The Crab pattern
- The Bat pattern
The Forex harmonic patterns can either be bullish or bearish chart patterns depending on the direction of the trend. They are either reversal or continuation patterns.
The Gartley, the butterfly,the Crab and the Bat pattern appear in form of “M” and “W” and can be differentiated by their Fibonacci measurements.
In order to successfully trade the harmonic patterns, you need patience.
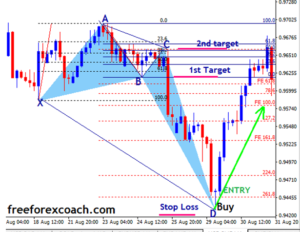
You should always wait for the completion of the pattern at point D.
This applies for the sake of Gartley,butterfly,Crab, Bat and A – B – C – D pattern.
Similarly, the three drive pattern gives entry signal when drive 3 completes. Then execute your trade with a good risk reward.
The 3 steps to trade the patterns.
- Identify the pattern first.
- Measure the pattern using Fibonacci retracement and expansion levels to confirm
- Execute a buy or sell position after the completion of the pattern.
The signal entry for Gartley, butterfly,Crab, Bat and A – B – C – D pattern is at point D.
On the other hand, for the three drive pattern,confirmation signals is at completion of drive 3.
After entry, place your Stop loss level a few pips below/above point D.
The safe target lies within 38.2 – 61.8% of AD move.
Draw a Fibonacci retracement from the start of the pattern to the completion of the pattern. Then set your target at level 1.618 of the retracement of the entire move.
They can lead to highly profitable trading opportunities when analyzed properly.Once you spot them,they are easy to trade and have good risk reward ratio.
Why you make small profits and take big losses?
Major Reason why You make Small profits and take Big Losses in Forex is because you have lost market objectivity. This is due the influence of greed, fear, regret and revenge. You trade what you are thinking instead of what you see! The problem is that traders want to...
- Oh, bother! No topics were found here.


