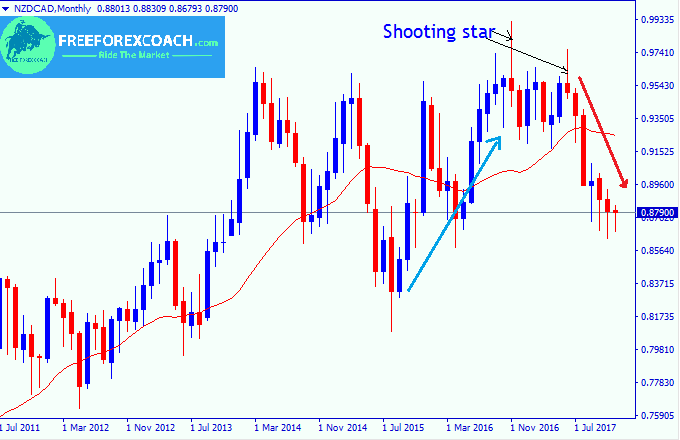
To trade shooting star candlestick in forex. you must have an uptrend. A shooting star is a bearish candlestick with a long upper shadow, a small real body near the low and a little or no lower shadow.
Price opens at a low and moves higher due to the buying pressure but later the sellers come in and push the prices back down closing below the open.
The Shooting Star candlestick is a bearish reversal candlestick pattern that appears at the top of uptrend.
The long upper shadow of the Shooting Star implies that prices first went up but due to strong selling pressure, it fell back down hence ending near the opening price.
After an uptrend, the Shooting Star pattern signals a possible change in the price trend to the down side. In fact, you can also use the shooting star to identify resistance levels.
In case you are to use a shooting star for a sell signal;
After the formation of a shooting star on resistance or after an uptrend, wait for the formation of a strong bearish candle to give you entry confirmation.
The formation of a big red candlestick after the shooting star is a good confirmation for an entry point. This shows that the buyers have given up and are out of market.
Example on how to trade Shooting star candlestick in forex

Like i mentioned before, formation of a shooting star after an extended uptrend is good signal for a sell entry.
From the NZD/CAD monthly chart above, you can clearly see how the market price started to fall after the first shooting star of Nov 2016. It then later completely reversed to the down side after the 2nd shooting star of June 2017 until now (Dec 2017). Those are 6 full months of profit
A shooting Star candlestick in forex may also appear as indicated on the chart below

This clearly shows the transition of interest from buyers to seller
Inverted hammer & a Shooting star candlestick pattern
An inverted hammer looks like a shooting star. Both have small real bodies at the lower end of the candlestick and long upper shadows
An inverted hammer, appears at the end of a downtrend. In precise, this is a bullish reversal pattern.
After a long downtrend, the formation of an Inverted Hammer signals bullish reversal. This shows that prices find it difficult to fall further.
The buyers open strongly pushing prices to the higher high. Suddenly sellers came back into the market and pushed prices back near the open.
The fact that prices still close above the entry, it simply means that the buyers are still in control
The formation of another bullish candlestick closing above the high of an inverted hammer gives a confirmation that buyers have gained full control.


With reference from the illustration above, we can tell that an inverted hammer appears during a downtrend. It is a signal that the trend is weakening and may reverse. The next blue candlestick after an inverted hammer gives a confirmation for the reversal
An Inverted Hammer on the Market Chart
Let’s see how it appears on the market chart.

An Inverted hammer is a bullish reversal pattern. It looks like a shooting star only that as a shooting star appears in an uptrend. An inverted hammer appears after a long downtrend.
When you notice this form especially on a support, prepare for a probable change in the trend direction.
What you should know is that the color of a shooting star and an inverted hammer does not matter. It is the position in which they appear that matters.
Points to note on shooting star candlestick pattern & an inverted hammer
- To trade shooting star candlestick pattern or inverted hammer, there must be a trend
- A shooting star appears at the top of an uptrend while an Inverted hammer appears at the bottom of a downtrend.
- A shooting star is a bearish reversal pattern whereas an inverted hammer is a bullish reversal pattern.
- Both the shooting star and an inverted hammer have small bodies with a long upper shadow that is at least twice their bodies.
- A shooting star is a strong signal for a sell position while an inverted hammer gives a strong signal for a buy position.
- A shooting star is more significant when it forms at a resistance whereas an inverted hammer is more significant when it forms at the support.
- In order to trade shooting star candlestick pattern, wait for a strong bearish candlestick to form after the shooting star to get confirmation. like wise, for an inverted hammer, wait for a strong bullish candlesticks as confirmation.
How procrastination can affect your trading success?
Procrastination to trade is when your trading set up confirms and you hesitate to take trade. Or your trade show all failing signals and you hesitate to close trade to cut losses. Also, in cases, where you sometimes hesitate to take profit because you want to...
- Oh, bother! No topics were found here.


