Market Time frames in Forex are represented by candlestick or bar on market chart.
Each candlestick/bar represents happenings and changes in the market for that period.
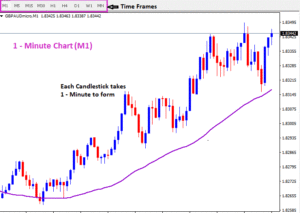
For instance, on a 1 minute chart, every 1 minute candlestick contains all price changes that happened in 1 minute. So each candle takes only one minute to complete.
If it is daily market time frame, then each candlestick takes day(24hrs) to form.
1 – Minute Chart(M1)

Therefore, Different time frames contain different records and can have different meanings to market traders.
As you try to analyse the market charts, you will notice a difference on charts on different time frames.
For instance,
1 minute chart may give a sell signal and looking at 5 minutes chart, it’s a different story. That shouldn’t scare you though thinking you are wrong.
It is normal for markets to behave in such a manner.
Why???
Because traders enter the market at different times and have different opinions about the market.
Most trading platforms show market Time frames in forex ranging from 1 minute to monthly.
Like we said before, each candlestick represents events in that time period on the chart.
They are;
- 1 minute chart(M1)
- 5 minute(M5)
- 15 minute(M15)
- 30 minute (M30)
- 1 hour(H1)
- 4 hours(H4)
- 1 day(D1)
- week(W1)
- 1 month(MN).
The Short time frames charts are known to have many trade signals but most of them are false signals compared to longer time frames.
So,
What can someone do to avoid being faked out in the market due to taking fake signals?
Ans: Use multiple time frame analysis.
Multiple market time frames in forex
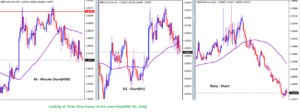
To trade with multiple time frame means you simply compare price movements of the same currency pair on different time frames.

You look at smaller time frames in relation to the larger time frames and only take trade when the smaller time frame is in agreement with the larger time frame.
Since the currency pair is on different chart time frames at the same time such as H1,D1,M1,W1, it means traders cannot have the same opinion about the market at different times.
As you try to analyse the market behavior, it is important to wait to enter until the smaller time frame is in agreement with the larger time frame.
Trading in the direction of the longer trend increases your chances of taking trades with a higher probability of success.
As a matter of fact a trader aims at increasing more odds/chances to his side and increasing the winning rate/success of the trade.
You need to first establish a trend/ direction of the trade using a larger time frame.
Then check whether the lower time frame charts and the longer time frame are in agreement.
Only then you can take position.
Let’s see how we can use different time frames to analyse .
For example if you are looking at a 30 min chart, you will consider 15 min as your smaller time frame and H1 as your larger time frame.
If you are looking at H1, consider 30 min and H4 chart. For H4, consider, H1 and D1. For a daily you can look at H4 and weekly time frame.
The way you chose the kind of time frames to analyse all depends on you and the time frame you intend to trade.
The bigger time frame
We use the bigger time frame to determine the direction of the trend.
Traders believe that since the bigger time frame takes long to form, it is likely to last for a while compared to other time frames.
Once you have determined the trend using a bigger time frame, your setup is at a greater advantage of hitting a take profit target.
The large time frames also help you to identify the strong support and resistance zones. It also helps you to know if the trend is nearing an end.
The middle time frame
This contains your trading set up and is what you consider for the confirmation of your entry.
The middle time frame is your trading time frame.
As soon as your set up is confirmed, trigger your trade, stop loss levels and any other necessary adjustments.
Why The small time frame
The small time frame helps you to pinpoint entry and exit points.
For instance,
if you want to go long on an H4 time frame and the daily time frame is pointing down.
And at the same time the H1 chart is just ranging or flat, wait to place trade until H1 confirms too. This protects you from being stopped out too early
Finally As we go through next lessons on this topic,
You will be able to understand which time frames to trade. Why you should do multiple time frame analysis before executing trades.
And why you should do analysis starting with a larger time frame to a smaller time.
And more examples on multiple time-frames analysis
Avaricious Life of a Newbie Trader.
Life of a Newbie Trader in Forex is super Interesting. With a lot of eager to make money, you never want to miss out on any chance. When you read about Forex trading, everything is simple. You may even start to think that your friends may not recognize you after...
- Oh, bother! No topics were found here.


