
In this USD/CNH Analysis, we shall focus on the 4-Hour and the Daily TimeFrame.
USD/CNH Analysis on Daily Chart
If you closely look at the Daily chart below. The major swing or the average move the price makes is complete. I could say the price swing is ‘exhausted’.
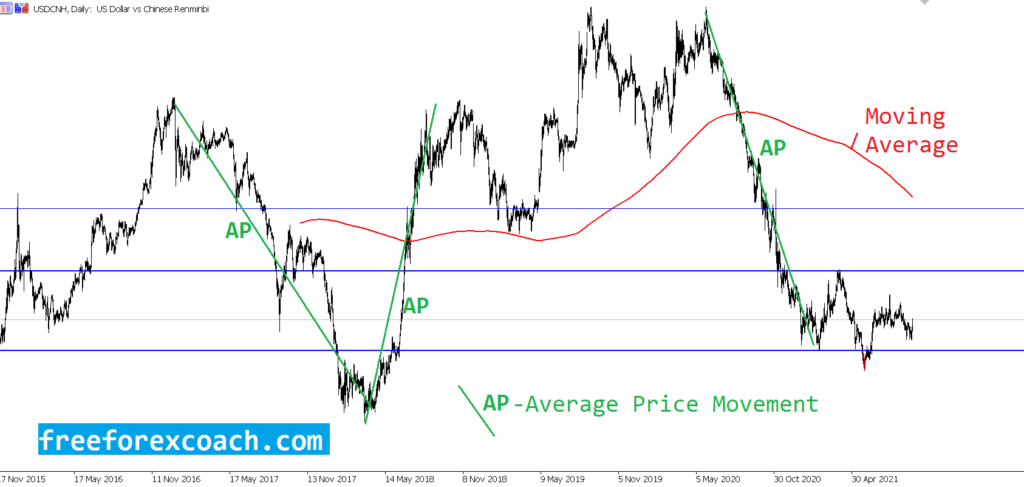
Looking at the above chart, this also means price is now in a large daily support zone therefore we can expect a reaction on this zone. This reaction could be a reversal or a large congestion phase. On this daily chart, price looks like it would go back up into the Red Simple moving average zone
So this is the point when you drop to the lower time frames to see how actually price is reacting to the support zone. In this case, we shall use the the 4-Hour Timeframe. Let’s now look at the 4-Hour Chart
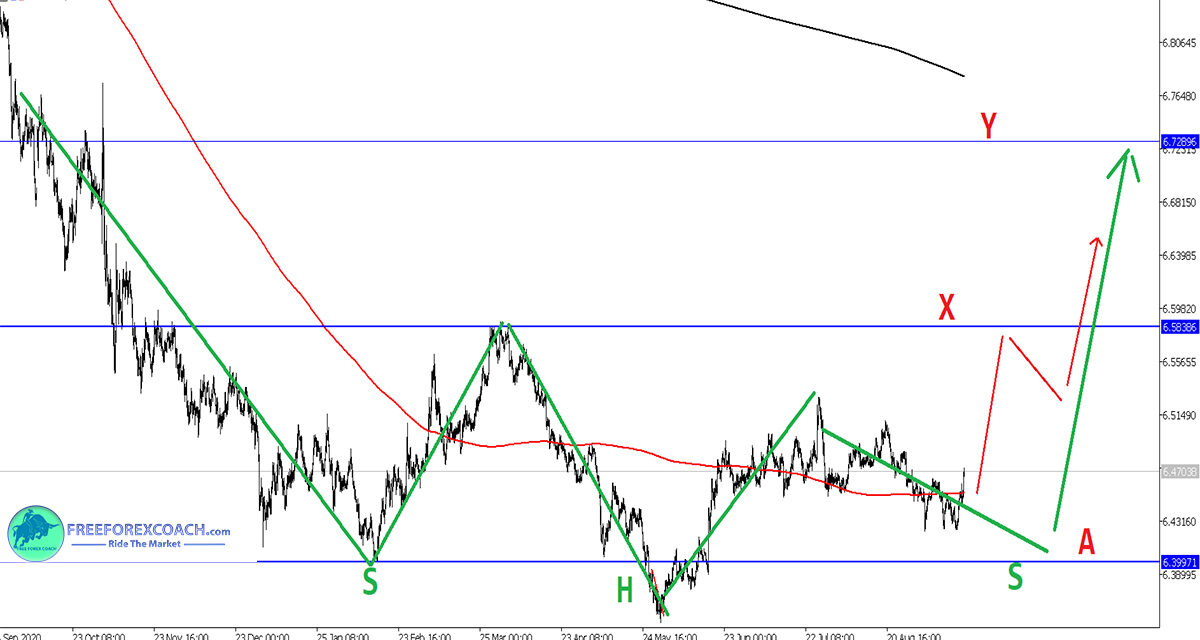
4-Hour Chart
Here we can clearly get a bigger picture of what’s happening on the large daily support zone.
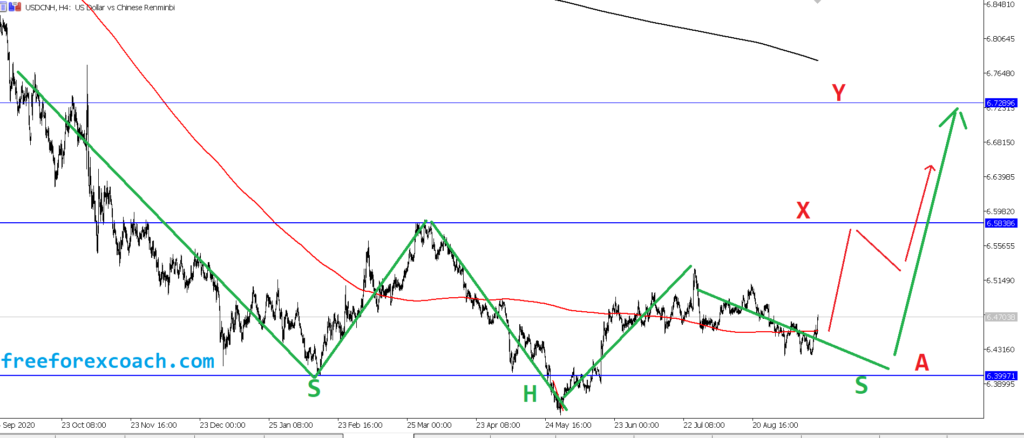
If you familiar with most chart patterns, this loooks like a Reverse Head & Shoulders in formation. The right shoulder still looks small so more congestion would be good. Preferably price MUST keep above horizontal line support A to keep the pattern valid.
The first target is at X resistance zone. Watch reaction on this zone to confirm price movement into next resistance zone target marked by horizontal line Y
The movement drawn red has to be traded with caution especially when price is on the X resistance zone. The level could hold and push the price much lower.
Don’t forget. if price now reacts and goes down back into the head zone (H), the reverse head and shoulders analysis will be invalid. So we shall now be look at completely different pattern analysis.
PRO TIP: In this kind of price exhaustion analysis, watch an average swing the price usually makes. If it looks exhausted/complete, drop to the lower timeframe to look for pattern formations for short term reversal or a complete reversal.
-Happy Trading-

