Choosing the best indicator in forex trading mostly depends on you. The best indicator is that which fits your trading strategy.
What is important is know how to use it and when to use it.
Previously we discussed the different types of indicators that you can use to trade and how they work.
These indicators are grouped differently which brings us to lagging indicators and leading indicators.
The leading indicators, You can consider these to determine trend direction since they react fast to price changes.
Conversely, lagging indicators react slowly to price change. They always lag behind price. this makes them good at giving confirmation signals to trade.
When choosing indicators to use, it’s good to combine the lagging indicator with the leading indicators to overcome their shortages.
The best indicator in forex trading would be that which fits your trading strategy and your trading style.
You don’t have to trade with so many indicators to get trade signals.
Start with the simple ones test them with your strategy and stick with what works better.
Some of the best indicator in forex trading
Trend following indicators
Moving Averages(MA).
A moving Average is a trend indicator. It always lags behind price action, therefore helps to identify the trend.
The moving Average moves below price when in an uptrend and above price when in a downtrend.
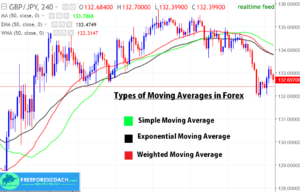
There are 3 main types of Moving averages.

- Simple Moving Average(SMA)
- Exponential Moving average(EMA)
- Weighted Moving Average(WMA)
Moving averages are technical indicators that smooth out price action and helps to forecast future prices.
You can use the moving average;
- To determine trend direction
- To generate trade signals
- Find trend reversals;
- Find potential support and resistance levels.
Bollinger Bands;
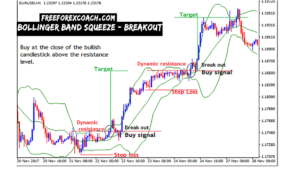
The bollinger bands is a trend following indicator that is used to measure price volatility. It comprises of two bands; the upper band , the lower band and the moving average between the bands.

The 2 lines of the band are plotted 2 standard deviations above and below the moving average(middle line).
When the bands expand, it’s an indication for increase in volatility. On contrary, when bands contract, it indicates a fall in price volatility.
In addition, you can also use the bollinger bands to find price trend.
Momentum indicators
Moving Average Covergence Divergence (MACD)
Trading with a good indicator, can lead to consistent profitable trading.
All in all,
However good your indicator may be, you can still make big losses when your trades are not managed well.
Stick to your risk management tools such stop-loss level, appropriate position sizes and follow your trading plan always.
We will discuss the details of risk management in the later sessions!
Why you make small profits and take big losses?
Major Reason why You make Small profits and take Big Losses in Forex is because you have lost market objectivity. This is due the influence of greed, fear, regret and revenge. You trade what you are thinking instead of what you see! The problem is that traders want to...
- Oh, bother! No topics were found here.


