Best way to Trade Breakouts in Forex to look for long market consolidations. Breakout trading strategy is a very popular strategy among the professional traders.
Price break outs are common on the Forex market charts and as a Forex trader you cannot avoid nor control it.
A price breakouts may lead to trend continuation or trends trend reversal.
You are likely to see breakouts on support and resistance levels, trend lines, channels and pivot points to mention but a few. They happen all the time and on all time frames.
At the end of this session, you will be able to know how to identify breakouts? How to differentiate break outs from fake outs? and of course how you can trade breakouts in forex!
What are Breakouts?
A breakout happens when price passes through the defined psychological price levels.
These levels include support & resistance levels, trend lines, price channels, moving averages, Fibonacci retracement levels, pivot points and chart pattern levels on the market charts.
When price hits these levels more often rejected on several attempts and after a while breaks through, that is called a breakout.
In simple terms, the price moves outside a defined price range such as support or resistance.

A breakout trading strategy is more valid after a long market consolidation.
This is when price has tried several times to break the identified levels of support and resistance but failed on several attempts.
After a breakout, price volatility always tends to increase and price moves in the breakout direction for sometime.
How do you trade breakouts in forex?
Bullish Break Out
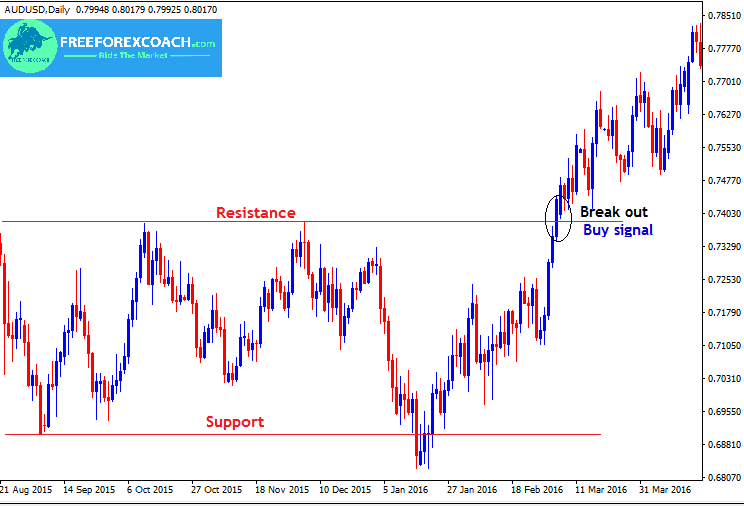
Take a look at the AUDUSD, Daily chart below;

From the above chart, you can see how long price battled on resistance level before breaking out.
A break out at a resistance level gives a buy signal.
The confirmation for the buy signal is the close of the bullish candlestick above the resistance.
Bearish BreakOut
Take a closer look at the GBPJPY 15-minute chart below

When you look at the chart above, it’s clear on how long price battled to break through.
On every attempt, price found support on the trend line and held several times. However, price can never hold for ever, it finally broke the trend line hence a sell opportunity after the breakout.
The confirmation for the sell entry is a bearish candlestick closing below the trend line.
The longer the market consolidates the more volatile the resulting breakout will be.
When price breaks above or below these levels with strong momentum, it moves higher covering many pips within a shortest time possible. Once more, Take a look at the chart above.
Previously on chart patterns such as triangles, rectangles, heads & shoulders, tops and bottoms ,we discussed how to trade breakout
You only enter a trade when price breaks out, and candle closes beyond the trend line in the direction of the breakout. That’s your signal confirmation.
Unlike chart patterns where you take the height of the pattern as your target profit.
For support and resistance breakouts, exit below the next resistance or above the next support after your entry.
What is Volatility?
Volatility is the rate at which the market moves.
When there is a very strong price movement within a short time after a break out, we say the volatility is very high.
The higher the volatility ,the higher chance of the success of your trade.
When the price is moving steadily or looks like it is not moving at all, then the volatility is low. This is usually identified by congestion and consolidations.
Congestion are a result of some traders in the market still holding back on their assets due to lack of confidence or they are conservative and need more confirmation.
Higher volatility makes Forex trading more attractive to the market players especially for day traders and scalpers but not so significant for the long-term investors who buy and hold.
Despite that, high volatility is sometimes a double edged sword.
Very high volatility cause large candles and tails in the market which easily hit stops and price continues in your predicted direction.
It can also expose you to very high risks when your prediction is wrong. Before you take any decisions you should have good risk management in place
In this case, price moves so fast that if your prediction is wrong, you make large losses in absence of no risk management in plan. Therefore, risk management is very important.
In summary
When trading breakouts in forex,
- Take trade immediately after the break of the support or resistance level.
- Have your stop loss in place always
- Or else, if you are a conservative trader, you can wait for a retest back on these levels and enter on the second confirmation candlestick pattern.
- Breakout confirmation is very important otherwise you may get faked out
- Buy on resistance after the breakout confirmation and sell on support.
- Place your target slightly below the next resistance for a buy trade or slightly above the next support level for a sell trade.
How procrastination can affect your trading success?
Procrastination to trade is when your trading set up confirms and you hesitate to take trade. Or your trade show all failing signals and you hesitate to close trade to cut losses. Also, in cases, where you sometimes hesitate to take profit because you want to...
- Oh, bother! No topics were found here.


