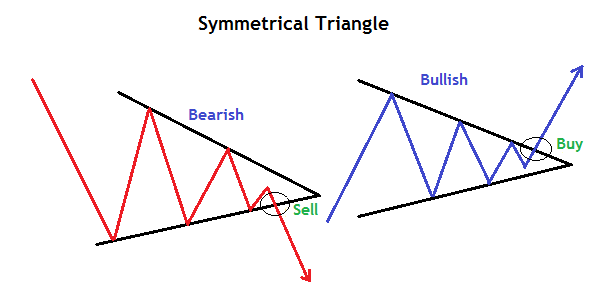
Symmetrical Triangle Pattern in Forex is a continuation pattern that shows periods of congestion in a trend before it continues.
It can form both in the uptrend and downtrend.
During this time,
The market is making lower highs and higher lows. This means that neither the buyers nor the sellers have the power to take over the market. Therefore price stays in congestion.
This consolidation/congestion holds a lot of uncertainty because it’s hard for traders to predict where the market is going for meantime.
Therefore, traders always wait for the price to break out of consolidation to make decisions to buy or sell.
The symmetrical triangle pattern
Formation of A symmetrical Triangle Pattern in Forex

The Symmetrical triangle pattern is made from the convergence of an ascending support line and descending resistance line.
Prices make lower highs and high lows. The pattern contains at least 2 lower highs and 2 higher lows.
Basically, what’s happening here is that the buyers and sellers have equal strength.
With no clear trend forming, price will keep squeezing smaller and smaller, following the trend lines until it is forced to breakout when it creates the apex.
The price break is the confirmation of the trend direction.
Symmetrical triangle confirmation
In an uptrend
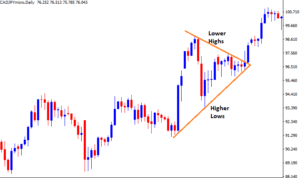
When formed in an up trend, the break and close of candle above resistance trend line gives a confirmation for a continuation in the trend.
This simply means that the buyers have finally taken control over the sellers.
An example of a symmetrical triangle pattern in an uptrend

You are also likely to see a shift of price momentum to the upside as price gets closer to the resistance trendline.
On contrary,
A price break on support in an uptrend gives a confirmation for a change in the trend direction since symmetrical triangles can also be reversal patterns.
In a downtrend
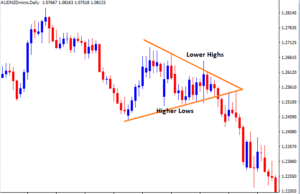
When the symmetrical triangle forms in a down-trend, a break and close of candle below support trend line gives a confirmation for a trend continuation.
Here is an example of a symmetrical triangle in a downtrend

Similarly,
Price momentum shifts to the downside as price nears the support line. A breakout at the support line gives a pattern confirmation and signals price continuation to the downside.
However,
If price break on resistance line of the triangle when in a downtrend, it indicates a likelihood for a change in trend direction.
The trade signal confirmation of a symmetrical triangle pattern is at the breakout on either sides of the pattern
How do you trade the symmetrical triangle pattern
To trade symmetrical triangle patterns, a breakout is very important.
Wait for confirmation of a breakout candle . It should close below or above on either the support line or resistance line.
After the break, price is likely to move at least the same distance as the one it covered during the formation of the pattern after the break.
Profit target and stop loss LEVELS
The Profit target is got by measuring the height of pattern at formation and projecting that same distance forward.
Set your Stop loss slightly below the lower level of the pattern for a buy trade/position or above the upper level of the pattern for a sell position.
Let’s look at an example on how to trade Symmetrical Triangle in Forex
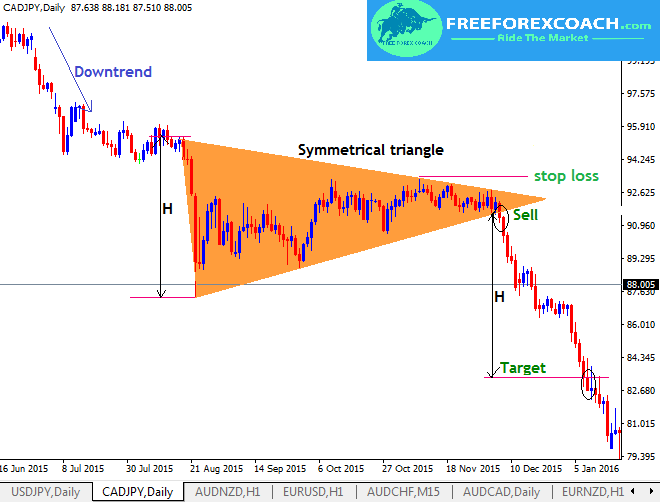
CADJPY, Daily chart.

The CADJPY Daily chart above ,shows a symmetrical triangle pattern in a downtrend.
Since it’s a continuation pattern, a prior trend is a must.
For instance, if you look at the above chart, price was falling prior to the pattern
The confirmation for a sell signal is the break and close of the candle below the support line as shown by a black circle.
We have the Profit target at the height H after the price break.
Stop loss is set slightly above the upper level of the pattern after entry.
As a rule of thumb,
The Profit target is got by measuring the height of pattern (H) at formation and projecting that same distance (H) downwards as shown in the chart above.
How Does Greed Impact your Forex Trading Success?
There are several ways greed can impact your Forex trading success. Firstly, greed can make you abandon your well crafted trading strategy in favor of impulsive and speculative actions. Instead of adhering to predetermined entry and exit points based on technical or...


