
In this article we shall focus on the GBPJPY Channel formation on the daily chart.
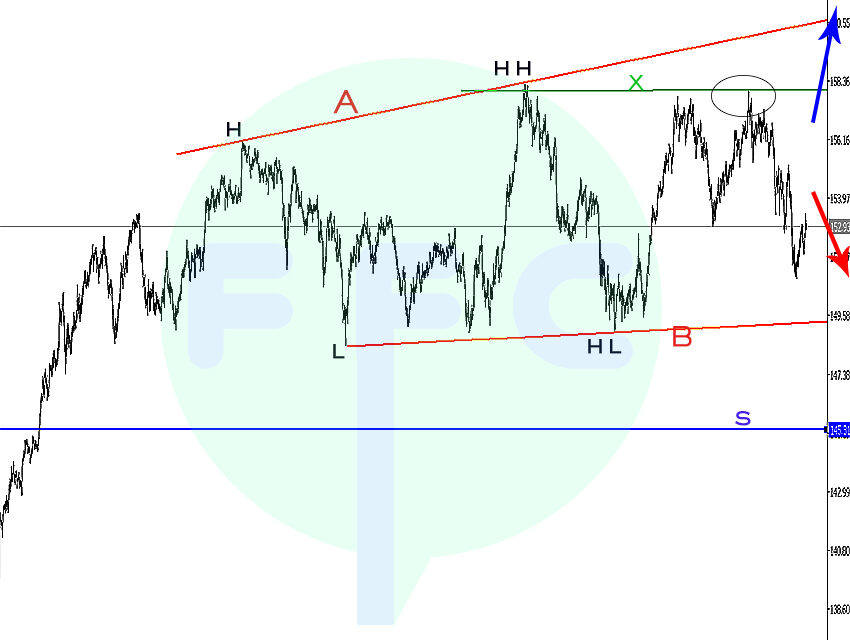
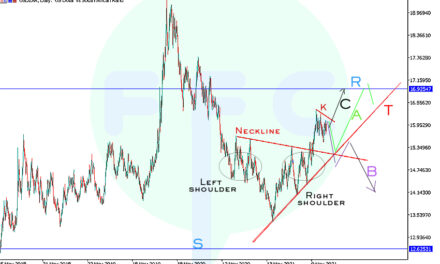
Let’s take a look at the Daily chart below
From the chart above, the GBPJPY channel formation is marked by red trend lines A and B.
If price closes above small green line marked X, price could head for upside to retest the trendline A and may be even go higher into the next resistance level marked with horizontal line H
A slight pull back on upside without breaking level X could lead price to fall into support zone marked S
So, the question is, Shall we have price continue on the upside or downside? To be able to answer this question & predict this movement, we need to look at what’s actually happening within the channel.
What bias is the channel potraying? Are the bulls stronger? or the Bears have the upper hand!
Therefore we drop to the lower timeframes to see what’s actually happening in the GBPJPY channel
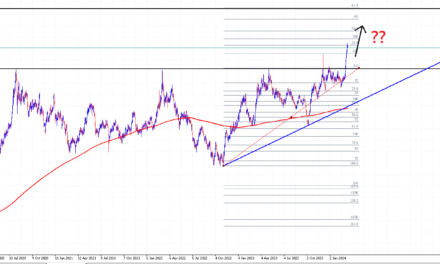
4-Hour GBPJPY Channel Formation
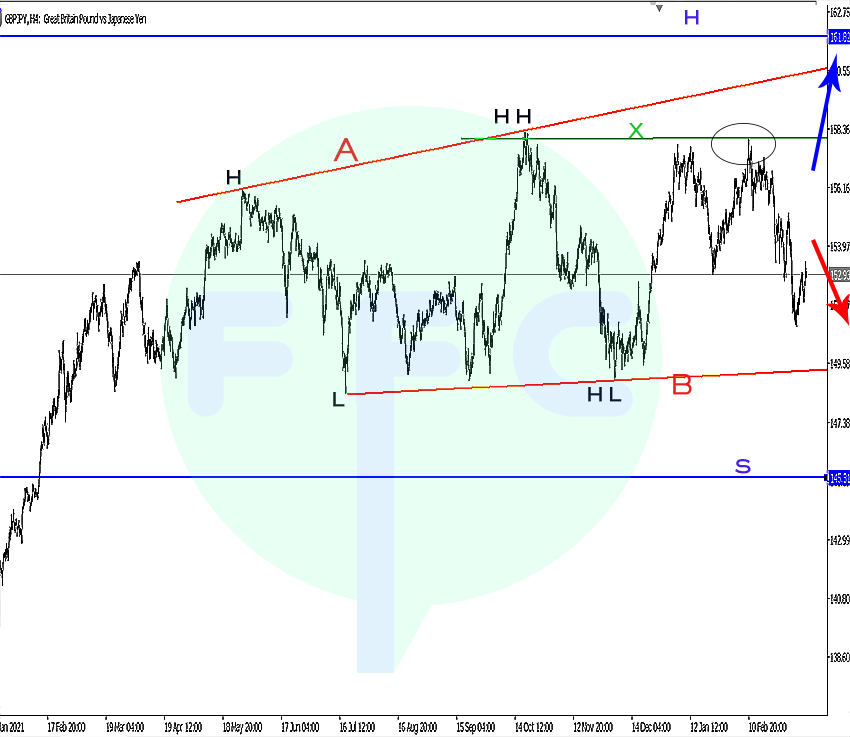
Looking at the H4 Chart above, we can say that as long price stays below the small trend line X, the channel bias is bearish.
Clearly you can see price in the channel at start showing bullish strength i.e higher highs and higher lows. Until we got to point where price fails break the most current high(HH2). The most current low (LH2) is not yet broken so there no trend change confirmation.
Therefore, since price failed to break the most current high, we say the bearish bias is much stronger than the bullish bias. The bearish bias will be confirmed when price breaks most recent lows
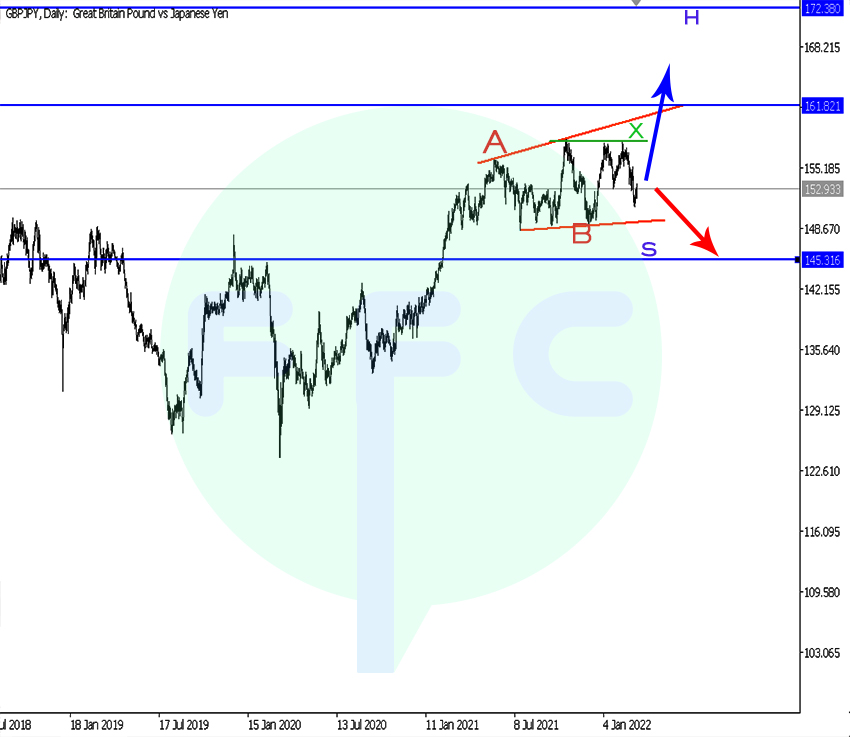
As shown on the daily chart, those 2 movements are the most likely to happen.
Wait for confirmations on tendlines. A confirmation is an actual candle body close beyond the marked level
Happy Trading!

