You can also use ADX to identify a Ranging Market just as we discussed earlier on using ADX to identify a trending market.
How to use ADX to identify a ranging market
Take a look at the USDJPY, 30-minute chart below;

From our chart above,
You can clearly see that when price was ranging the ADX indicator was below 25. This area is shaded with light purple color on our chart above.
The lime color represents the ADX above 25 indicating price out of range.
Just looking at the ADX readings, you can now easily tell if price is in a ranging market or trending market.
let’s look at another example

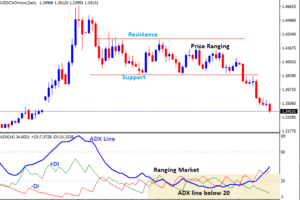
ADX indicator below 20 indicates a weak / no trend.
From the above chart,
you can see how price dropped after a strong uptrend and then moved side ways in a range.
When the ADX line(blue) crossed the 20 level below, price also dropped and started ranging finding support and resistance levels.
In case you were holding a long position, you would close trade as the indicator settles below 20.
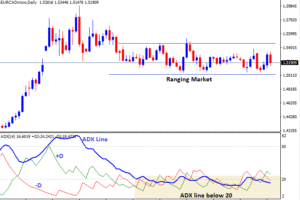
As ADX falls further, the trend gets weaker. Look at the Chart below;

Brief notes on ADX
The Average Directional Index (ADX)is a three lines indicator that measures the strenght of a trend. You add it below the chart on your trading platform.
It comprises of 3 lines
- The ADX line,
- Minus Directional Indicator (-DI)
- Plus Directional Indicator (+DI)
The 3 indicators in one are used to tell both the trend direction and the trend strength.
The ADX fluctuates from 0 and 100.
- When the reading is below 20, it indicates very week or no trend.
- ADX Values between 20 and 50 signal a trending market.
- Values between 50 and 75 very strong trends
- When ADX is below 20, signals weak trend and above 50 strong trend
+DI and -DI
- When the +DI is above the -DI, buying is stronger than selling hence strong uptrend.
- On the other hand, when -DI is above the +DI, selling is stronger than buying, strong downtrend..
ADX indicates a ranging market when the scale reads below 25. A trend continues to weaken as the indicator approaches 20 and falls below.
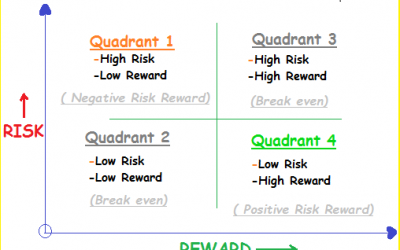
Risk Reward ratio Quadrants: The Difference between Amateur and Professional Traders!
Risk reward ratio (RR) is the “holy grail” of trading. Risk reward ratio Quadrants identify where you actually belong in your trading business. RR is the most important metric in trading and a trader who understands it can greatly improve his/her chances of becoming...
- Oh, bother! No topics were found here.


