To use ADX to determine Trend Direction, it is combined with the Directional movement +DI and -DI. +DI shows an uptrend on the indicators and -DI shows a downtrend.
In general, the bulls have the edge when +DI is greater than -DI, while the bears have the edge when -DI is greater.
After the cross of these indicators (-DI and +DI), we are able to tell the direction of the trend on the market chart.
The Average Directional Index (ADX) is used to measure the strength or weakness of a trend, not the actual direction.
How to interpret the ADX indicator with +DI and -DI on the Chart
The ADX fluctuates from 0 and 100.
When the reading is below 20, it indicates very week or no trend.
ADX Values between 20 and 50 signal a trending market.
Values between 50 and 75 very strong trends
When the +DI is above the -DI, buying is stronger than selling hence strong uptrend.
On the other hand, when -DI is above the +DI, selling is stronger than buying, strong downtrend.
However, at the crossovers of +DI and -DI,the ADX indicator should be above 20 for a trending market.
How to use ADX to determine the direction of a trend
ADX Showing Uptrend
Let’s take a look at the AUDJPY 4-Hour chart below and see how this indicator works.

From the above chart, ADX is represented by the Blue line, +Dl is the Green line and -DI the Red line.
As the ADX indicator read values above 20 (pink color), it indicated a strong uptrend and as it read values below 20 (light blue), it indicates a ranging market or a very weak trend.
Therefore bearing that in mind, you should be able to tell whether the market is trending or ranging.
The +D line indicate an uptrend and when above -D line, it signals a strong uptrend.
The -D line indicates a downtrend and when the -D line (red) is above the +D line(green), it signals a strong downtrend.
In this case, the ADX line stayed above 20 most of the time with the green line +DI following. This is an indication for a strong uptrend in the period. Once more, Take a look at the above chart.
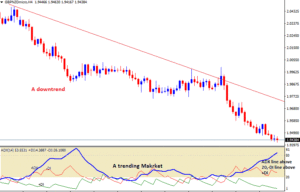
ADX to identify trending market in a downtrend.

When ADX is above 20, it indicates a trending market. The -DI line on the indicator above +DI shows a downtrend.
You can clearly see from the candlestick chart above that price is in a strong downtrend.
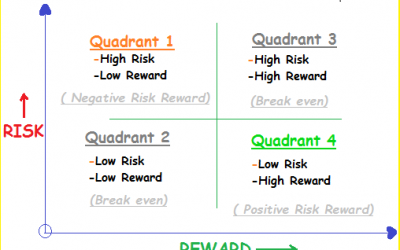
Risk Reward ratio Quadrants: The Difference between Amateur and Professional Traders!
Risk reward ratio (RR) is the “holy grail” of trading. Risk reward ratio Quadrants identify where you actually belong in your trading business. RR is the most important metric in trading and a trader who understands it can greatly improve his/her chances of becoming...
- Oh, bother! No topics were found here.


