You can use moving averages to find trends in forex because they help to smooth out price action. This helps to forecast future prices.
Like we saw earlier, a Moving Average follows the price movement in a trend because it is a lagging indicator.
A moving Average is a technical analysis trend indicator.
Trend is simply a price that continues to move in a certain direction for a period of time. In simple terms, it is a long term one price direction.
There are mainly 3 trends that price can follow.
- An uptrend, the continuous movement of price in the upward direction
- A downtrend, the continuous movement of price in the downward direction
- Sideways trend, prices moves in the sideways direction
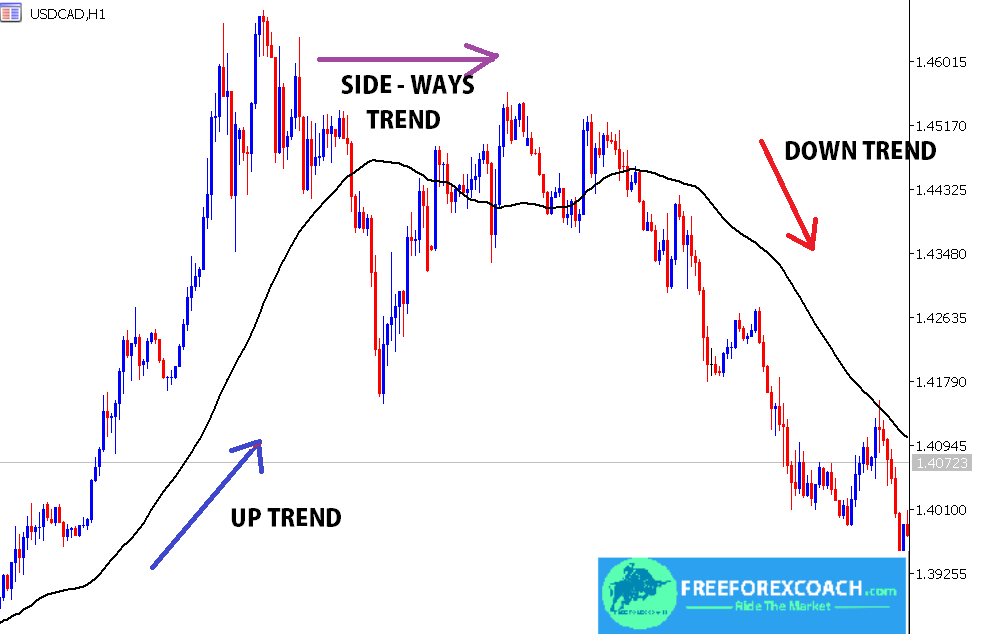
When you see moving average is rising and price is moving above the moving average, this is considered an uptrend.
On the other hand,when the moving average is falling and price is moving below the moving average, it is a downtrend.
For a downtrend, moving average moves above price while in an uptrend, moving average moves below the price.
Mean while, as the moving average line gets closer or crosses through the price trend, it indicates a possible change in trend direction.
Therefore, you should expect a possible reversal or just a pause in price movement.
Take a look at the chart below

To avoid false signals, traders use several moving averages on the chart.
For-example, you can combine the simple moving average and exponential at the same time. One is faster than the other therefore it becomes easier to know whether it is a fake out signal or a correct signal.
We shall discuss this strategy details in the next lesson
How to use more than one moving averages to find trends
Let’s take a look at the chart below;

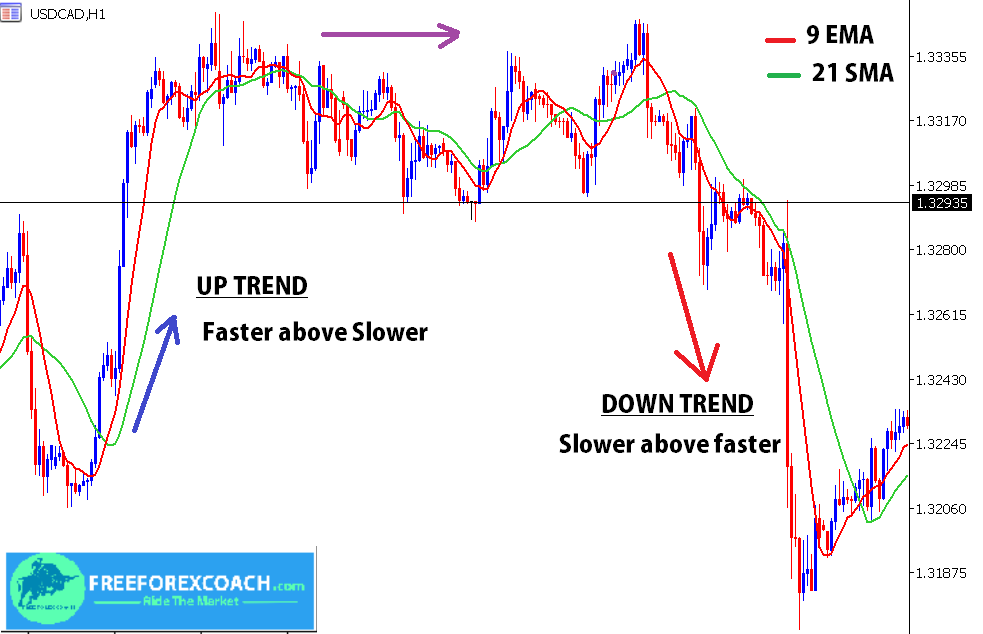
Taking a look at the above market chart, we are using the two moving averages.
- Red – 9 Exponential moving average (fast)
- Green – 21 Simple moving average. (slow)
From the chart above,
If the faster (9) moving average is above the slower (21) moving average and rising, that shows that price is in an uptrend.
On the other hand, if the slower (21) moving average is above a the faster (9) moving average and falling, that shows that price is in a downtrend.
The faster moving average moves almost at the same pace as price as the slower lags behind them.
When price crosses the faster moving average, it is likely to be a fake out. As the slower moving average approaches the faster moving average and price moves closer to the two moving averages, its a strong signal for change in trend.
The crossover of the two moving averages signals possible change in trend direction. therefore, it would be a good time to enter trade with proper risk management
Using Moving averages to determine price momentum in the market.
 When the market is in an up/down trend, and the faster moving average diverges from the slower moving average at a wide distance.
It indicates a rise in momentum.
But when the two moving averages converge/contract and price tends to pull back/ congests, it indicates a slow down in momentum.
This gives you a warning in case you are holding any running trade to prepare to exit or tighten your stop loss.
How to plot a Moving Average on your Trading chart
Lets get started.
Once you have logged in to your trading platform, open your chart.
Pick a pair that you intend to trade for analysis. OK. Hope you are on your charts now.

- If you are using the MT4/MT5 trading platform, move your mouse cursor to the top right or just to the upper tool bar and place it on indicator icon, it has a small cross on it.
- If you can’t find it, check all the icons in the tool bar until you see one that is named “Indicators list.” Do the same if you are using other platforms.
- Just click on it, it will bring a list of all the indicators on the platform.
- On the list displayed, move your cursor down and select trend. if it displays moving average directly, just choose moving average.
- When you place your cursor on trend, it will display a list of trend indicators, select moving average.
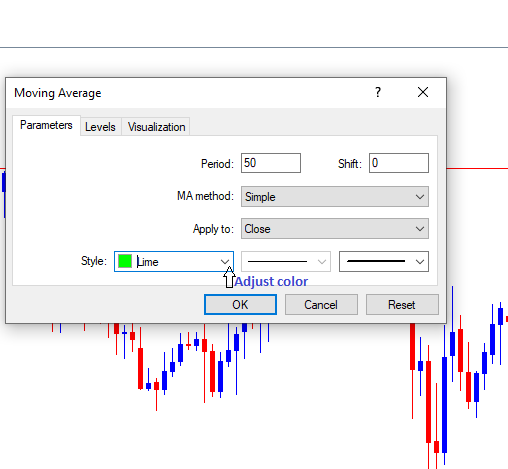
- At this point, a small square containing moving average properties will display on top of your chart.
You can adjust the moving average period you intend to use, the color(style) and the type of moving average. when you are contented with your adjustments, press OK. Your moving average should appear on the chart.
Conclusion
Moving averages are not only used to identify trend direction and determine price momentum but also to identify levels of support and resistance.
Finally, moving averages work better when combined with other indicators to trade. we shall learn more on moving averages and how to trade them as we go further in the next lessons.
HOW TO ACHIEVE FOREX TRADING SUCCESS
Success in forex trading is highly possible but does not come on a silver plate. To achieve forex trading success, it requires you a lot of patience practice and discipline. Forex trading can be one of the most rewarding professions for anyone who wants to master the...
- Oh, bother! No topics were found here.


