To Avoid Early Entries Trading Divergences in Forex, you must take your entries after confirmation on the oscillator.
Or else you will always be stopped out few minutes after your entry.
To profit while trading divergences, you need to have perfect entry timing therefore every set up requires patience and discipline
But the fact that you are here, Free Forex Coach, will teach you how you can avoid early entries trading divergences & make a profit out of it.
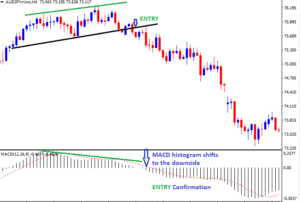
1. Wait for a crossover of the histogram on the MACD indicator.
The shift of the MACD histogram acts as a confirmation signal for the trade entries on divergences.
This indicates a shift in momentum from either the buyers or sellers depending on the trend direction.
Suppose you were using MACD indicator, as the histogram makes bottoms or tops, price also does the same.
Draw trend lines on the indicator so that you are able to compare the indicator top or bottom positions with the price action.
Take a look at the chart below

After confirming a divergence, patiently wait for the histogram to cross over to the other side of the zero line.
When this happens, this shows that either the buyers or sellers have given up and the trend reversal could be a head or continuation .
It is now time to buy or sell.
From the above chart,
When the MACD histogram crosses from above the zero line down, it an indication for change in momentum from the buyers to the sellers.
The opposite is true.
2. Divergence works better in extreme conditions; Overbought and Oversold conditions
Technical oscillators like Relative Strength Index(RSI) and Stochastics show oversold and overbought conditions in the market.
Divergences are more reliable during the overbought and oversold market conditions.
Relative Strength Index (RSI)
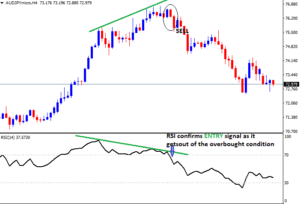
When price hits the overbought conditions the RSI indicator crosses the 70 level.
This indicates that momentum in the uptrend is likely to change because the currency pair is overbought.
Wait for the confirmation for trend reversal when the RSI crosses below the 70 level pointing down.
Take a look at the Chart below

After you have spotted a divergence,
Patiently wait for the RSI indicator signal confirmation. If you can take a good look at the above chart, as price changed direction, the indicator did the same.
The fact that it already indicated the overbought market condition, the trend stands high chances to change direction.
The stochastics Indicator

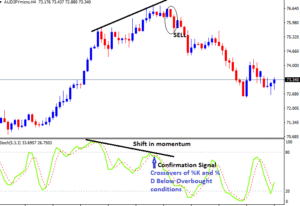
From the Chart above,
The shift in momentum signals possible change in price trend direction.
When the indicators gives crossovers below the overbought line pointing down, take your short position.
Like any other indicator, divergence indicators are not perfect, therefore expect to face fake signal along your trading journey.
To get stronger confirmation combine the oscillators with other technical indicators such as trend line and support and resistance.
You should also consider trading on a higher time frame. The higher the time frame, the more reliable the signal is.
For instance, a divergence on a daily chart is much more significant than that on a 5 minute chart.
HOW TO ACHIEVE FOREX TRADING SUCCESS
Success in forex trading is highly possible but does not come on a silver plate. To achieve forex trading success, it requires you a lot of patience practice and discipline. Forex trading can be one of the most rewarding professions for anyone who wants to master the...
- Oh, bother! No topics were found here.


