You can use MACD and RSI indicators to measure strength of a BreakOut in Forex.
The MT4/5 platform provides a variety of oscillators that help us to measure the strength of price movements.
To learn more about these oscillators you need to get back to the previous topic on Oscillators.
After a small pause in the price trend,
we always see price breaks out strongly either to the same direction or opposite direction. Good enough we now know how to deal with that.
You wait for the breakout confirmation in forex to decide whether price will continue or reverse.
Now the question is, How do you know the strength of price price breakout??
You can use the MACD indicators or the RSI indicators.
How do you Use the MACD indicator to measure the strength of the breakout
The Moving Average Convergence Divergence (MACD) indicator is one of common indicators most traders use.
MACD histogram does not only measure the strength of a trend but also gives trade signal setups.
To use the MACD, watch the divergences between the price action and the histogram.
How MACD measures momentum is our question of interest.
If you still needed more about this indicator, checkout on the notes in one of the previous sessions about indicator, MACD here.
Examples on how measure strength of a breakout in forex using MACD
Example 1
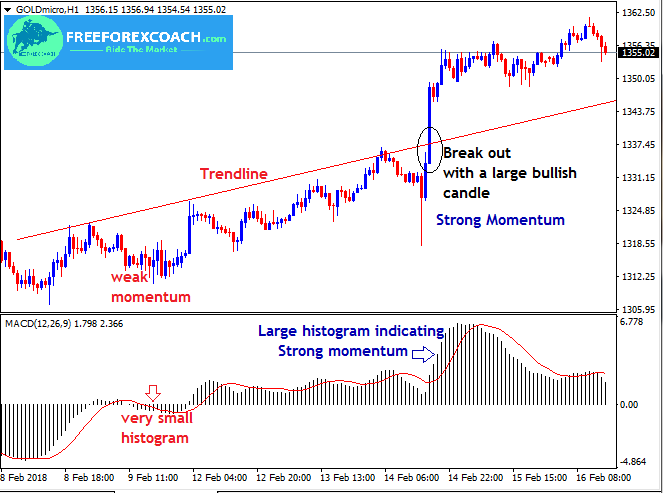
Take a look at the Gold Hourly chart below;
When the histogram gets smaller, it indicates weaker momentum in the trend.
When the histogram gets bigger, this means the trend momentum is increasing or stronger.

So judging from the above chart,
You can easily tell that the histogram falls following a weak momentum in the trend. This may signal a probable change in the direction of trend.
On the other hand, a rise in histogram follows increase in momentum of a trend. This signals a strong trend a head.
After price broke the trend line, it confirmed with a large bullish candlestick. Also, when you check the MACD histogram, it’s size increased compared to the previous histograms.
This is an indication for a strong momentum coming up in the trend.
As the trend rallies fast, the MACD histogram continued to grow bigger and bigger indicating strong momentum in the trend
If price breaks with strong momentum, there is high possibility that the trend will rally longer compared to when price breaks with low momentum.
Example 2

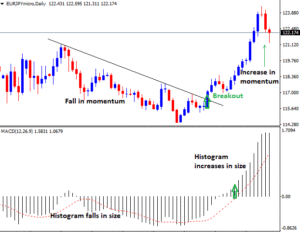
From the above chart,
You can see that as price fell, the MACD was getting smaller.
As the histogram expanded to the upside, price broke the trend line and continued rising.
How do you Use the RSI indicator to assess breakouts
With the relative strength index (RSI), you can identify the shift in momentum just looking at the divergences.
The divergence between price action and the indicator.
Also the RSI indicates the oversold and overbought conditions.
Divergences signal trend reversals as well as the overbought and oversold market conditions.
Find a full topic on RSI in our previous lesson about the RSI
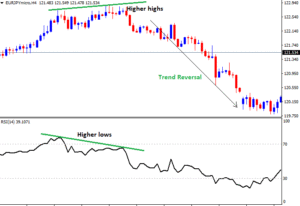
If the price reaches higher highs but RSI is not able to to reach the new higher high, there is a bearish divergence. Sell on completion of the divergence
If price reaches the new low and RSI fails or forms a high, there is a bullish divergence. Buy after noticing this kind of divergence.

Divergence indicates fall in price momentum.
From the above chart, you can tell how price charged course after divergence.
HOW TO ACHIEVE FOREX TRADING SUCCESS
Success in forex trading is highly possible but does not come on a silver plate. To achieve forex trading success, it requires you a lot of patience practice and discipline. Forex trading can be one of the most rewarding professions for anyone who wants to master the...
- Oh, bother! No topics were found here.


