Double bottom pattern in forex is a bullish reversal pattern that forms after an extended downtrend signaling a change in trend. let’s take a close look at what double bottoms are?
What is a double bottom pattern in forex?
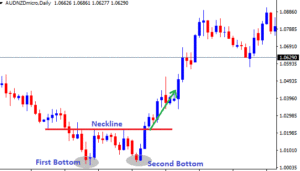
A double bottom pattern in forex comprises of two bottoms below a resistance level(the neckline) giving it a shape of a W.
It is a bullish reversal pattern.

The first bottom forms immediately after a strong downtrend trend. price then retraces to the neckline and then falls back to the down side.
When it bounces back to the neckline again, it then forms a double bottom. The bottoms hold at the same point which can be identified as a support zone.
Just like on the double top, usually the volume is high on the first bottom. It then reduces as the pattern forms and again increases as the pattern completes the formation.
The pattern is considered complete when price breaks the highs or resistance line.
As the price breaks the resistance line , we expect a reversal to the upside.
Confirmation of Double Bottom
The resistance level commonly referred to as the neckline acts as the trigger line for the confirmation. Entry-level is in the direction of the reversal breakout.
After spotting two bottoms after a strong downtrend move, look for 2 things;
- The Neck Line
- Breakout candlestick at the neckline/resistance level.
The Neck Line
Draw a horizontal line from the first high of the first bottom and connect it to the last high of the second bottom.
This forms a resistance level or a small trendline.
Breakout on the Neckline
The pattern is valid when the price action breaks the Neck Line with a bulliish candlestick closing above the neckline.
You can also consider a price retest after the break for extra confirmation. Then trade the pattern in the direction of the breakout.
When a bullish candle breaks and closes above the Neckline, the pattern is complete and confirms the Buy signal.
Let us look a few examples on how to trade double bottom pattern in forex!
How to trade Double Bottoms
Steps to trade a Double Bottom Pattern in Forex
- Identify a strong downtrend
- Spot the Double bottom pattern.
- Draw the Neck Line
- Confirm the validity of the pattern. Wait for the Neckline Breakout. If bullish candlestick closes above the Neck Line it confirms the completion of the pattern.
- Take the trade. Buy/Long the pair.
In case you are a conservative trader, wait for a price retest after the price break on the neckline. This is a second entry confirmation. Just to be more sure about the price breakout
Stop loss and Take profit Levels
Put your stop level slightly below the lower low/bottom (1st or 2nd) of the pattern.
If both bottoms are on the same level, put your stop level slightly below the lows/ bottoms.
Measure the size of the pattern(height) from the neckline to the lowest bottom and then apply it upwards starting from the Neck Line. This would be your minimum target profit.
Trading Double Bottoms
Example 1: USDJPY, 4-Hour Chart

From the Chart above after an extended downtrend;
The Buy entry was at break & close above the neckline.
The Stop loss just below the higher bottom in this case it was the first bottom.
The target was got by simply measuring the height of the pattern and projecting that same distance from the neckline upwards.
Example 2: AUDUSD Daily Chart

On this above example,
Buy signal too was at break & close above the neckline.
The Stop loss just below the higher bottom in this case it was the second bottom.
The target was got by simply measuring the height of the pattern (H) and projecting that same distance from the neckline upwards.
PRO TIP: The pattern is only Valid after an extended down trend.
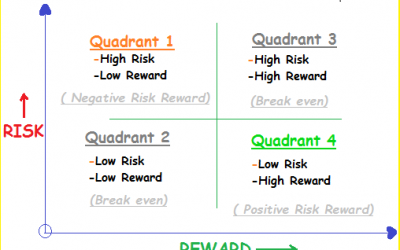
Risk Reward ratio Quadrants: The Difference between Amateur and Professional Traders!
Risk reward ratio (RR) is the “holy grail” of trading. Risk reward ratio Quadrants identify where you actually belong in your trading business. RR is the most important metric in trading and a trader who understands it can greatly improve his/her chances of becoming...
- Oh, bother! No topics were found here.


