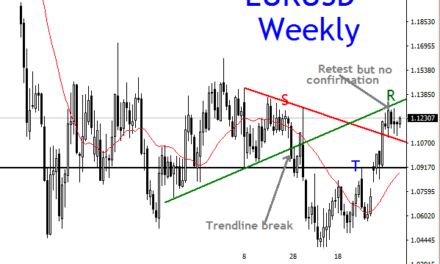
EURUSD Pending Reversal is shown by price coming into the large Daily Resistance Zone marked R1 & R2. The momentum in the price has slowed down indicated by the overlapping daily candles.
Take a look at the Daily Chart below;
Daily Chart EURUSD
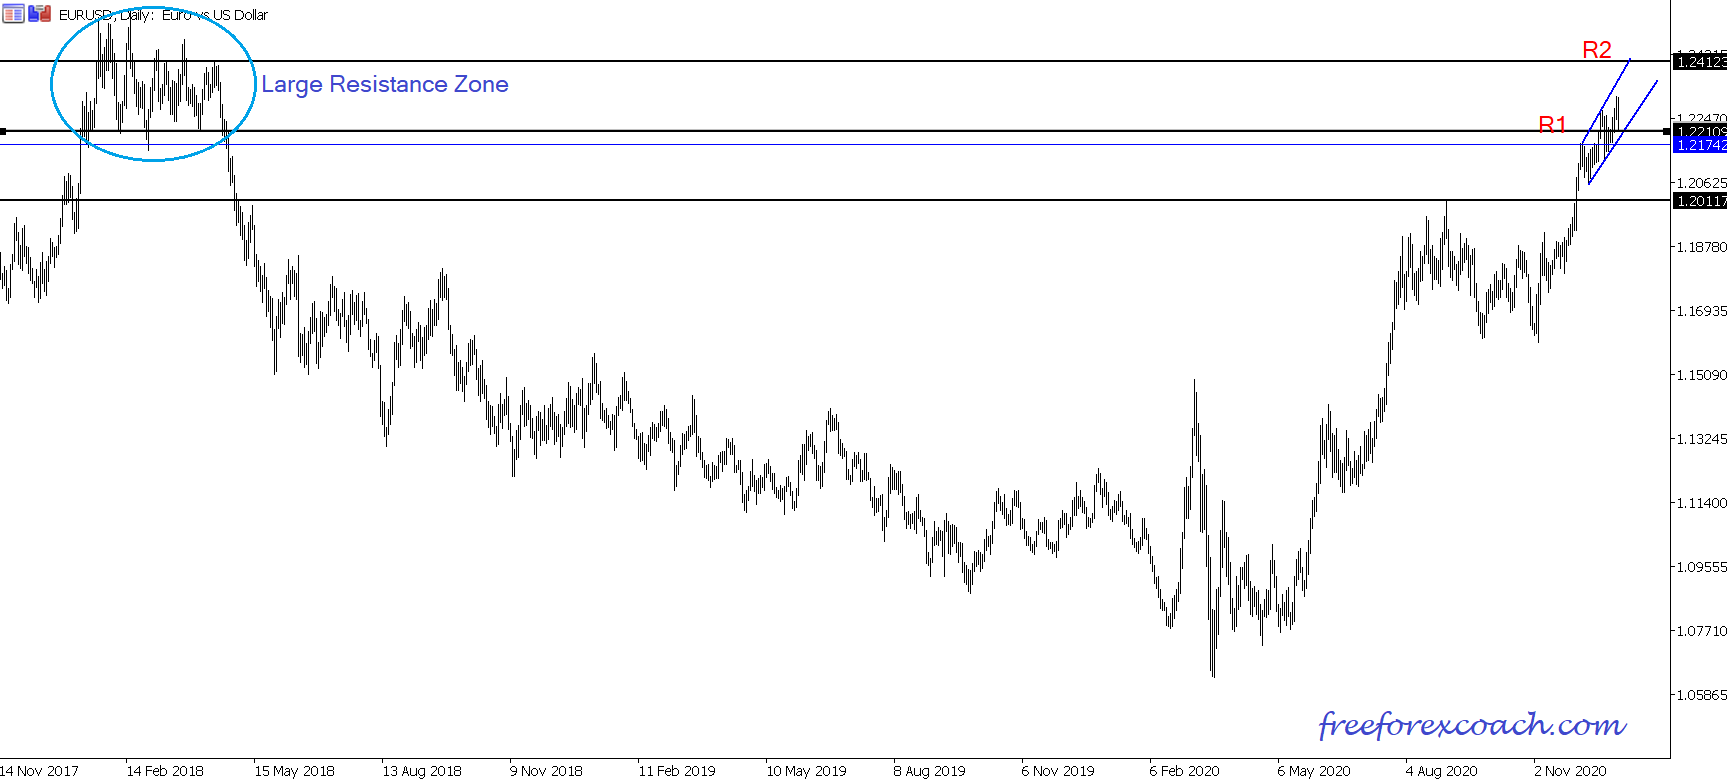
The Resistance is quite large so we could have more up and down movement before we have a good reversal reaction.
Ler’s now take a deeper look on the 4-Hour TimeFrame Price Action.
4-Hour Time Frame EURUSD Pending Reversal

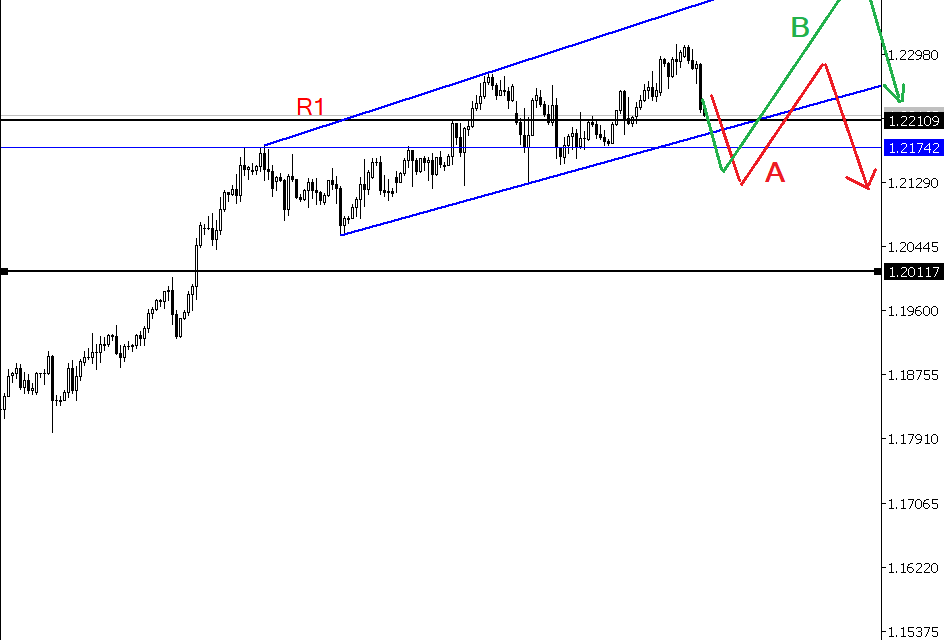
The falling momentum is clear shown by by expanding price channel with some up and down waves. R1 and R2 resistance is same as those marked on the Daily Chart.
1.24123 resistance zone zone R2 is surely a better reversal zone if price manages to get there.
Current price movement still shows buyers’ presence despite the depreciating power. This gives a chance for another swing on the upside before we can have s better reversal.
The now price action can shift movement in many ways.
- We could have A reaction. In this case price goes/retraces abit deeper and goes back to retest to the highs giving a head and shoulder shape-like formation.
- Or there could be a B reaction. Here price doesn’t retrace so deep, it aims for another swing high into the upper parts of the larger resistance zone
Conclusion.
EURUSD pending reversal is near. Keep watch on the price action for better confirmations before taking any short trades. If you were in a long position. Prepare for your exits.

