Risk Management Lessons
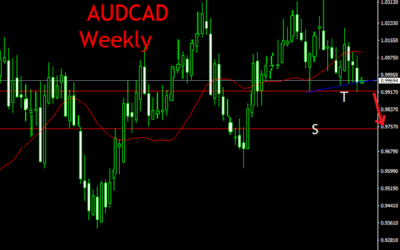
AUDCAD WEEKLY AND INTRA-DAY TRADING TECHNICAL ANALYSIS
WEEKLY CHART The price already shows strong signs of bearishness as it is being held by support zone marked T. Confirmation of fall of the price will be close of the weekly candle below support zone marked by red horizontal line marked T around 0.99164. This may lead...


