Market Sentiment Analysis Summary is an over view of what we covered in previous lessons including COT report.
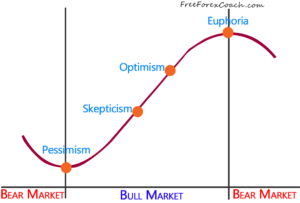
Market sentiment represent traders opinions about whether the currency pair will rise or fall in future.
The Forex market moves due to the changing perceptions and feelings of different traders in the market. Not the indicators or chart patterns.
Market sentiment defines the feelings, emotions and perception of all market participants.
If traders think that a certain pair will appreciate in value in future, more will buy that currency and so the price will trend upwards. The opposite is true when price falls.
As a Forex trader,
You should always aim at developing your market sentiment in relation to what the market says.
What you think as an individual doesn’t matter in the market of more than a million participants.
When it comes to market sentiment, the majority traders opinion determine the market direction.

If the majority traders are buying,the trend is up, do the same. Similarly if the majority traders are selling, the trend is down, it means you should also sell.
How to read market sentiment on the market chart
There are different ways you can read the market sentiment on the market chart.
1. Compare the direction for the trend using both the small time frame and the large time frame. Trade only when the two are in agreement.
2. You can also use price action.
If the market moves up very fast and slows while falling it shows that the base currency is stronger than the quote currency.
Therefore the market is more bullish. The reverse is true for a bearish market.
3. In addition, use price momentum of a price trend. If a currency pair starts making lower highs in an uptrend, it shows that the bulls are losing momentum.
Let’s look at COT as part of the Market Sentiment Analysis Summary
Commitments of traders’ report(COT)
You can also use the Commitments of traders’ report. It is released by the commodity future traders commission CFTC every Friday at 2:30 pm EST.
It shows the positions of the two largest players in the market.
The large speculators include the hedge funds and bankers, the commercial traders include corporations and retail traders.
Traders usually look on the extreme long or short positions in order to pick the market tops or bottoms.
The market tops show that traders are extremely long and the currency is overbought so the prices are very high.
The market bottoms show that traders are extremely short; the currency is oversold and the prices have fallen very low.
When you compare long or short positions with the previous week’s reports you can see if more shorts or long positions are added.
A sudden shift in the position could also bring a sign of market reversal.
However, you cannot rely on the COT reports alone to execute positions.
After interpreting the report, you should use the information and align it with other technical and fundamental indicators to make your judgment to trade.
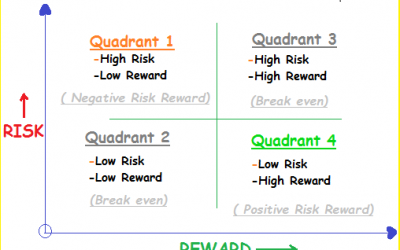
Risk Reward ratio Quadrants: The Difference between Amateur and Professional Traders!
Risk reward ratio (RR) is the “holy grail” of trading. Risk reward ratio Quadrants identify where you actually belong in your trading business. RR is the most important metric in trading and a trader who understands it can greatly improve his/her chances of becoming...
- Oh, bother! No topics were found here.


