Oscillators Forex indicators commonly used are the RSI, MACD, and Stochastics indicators.
The oscillators are price momentum indicators. They warn traders when momentum is high or low.
Since they are not price following indicators, they are applied at the bottom of a currency pairs on the chart.
They are mostly favored by traders because they indicate possible changes in trend direction.
Oscillators forex indicators are also used to find out overbought and oversold levels, as well as bullish and bearish divergences.
With the oscillators, traders can easily tell when the trend is ending or starting hence give good signals to trade.
Just one look at the overbought and sold conditions on the indicator.
Macd – Oscillators forex indicators
MACD is a moving average convergence divergences indicator.
Most traders use MACD to identify reversal points in a trend and for trend confirmations.
The moving average convergence divergence detects momentum change and signals over bought and oversold conditions.
It has a histogram which represents the difference between the MACD line and the signal line.
The histogram is a bar chart plotted around the zero line indicating the relationship between the MACD and the signal line.
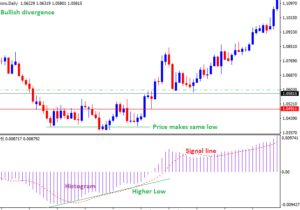
When the MACD crosses the signal line and the histogram crosses the zero line,it signals possible trend change.
If the MACD is above the zero line, prices are trending higher, when below zero prices are falling.
You can use the MACD to identify possible reversal signals in form of the bullish convergences and bearish divergences.
For instance check how price reacted after a bullish divergence on the chart above.
When market prices forms the lower low and the MACD forms the higher low it is gives a bullish divergence.This can result to a trend reversal(bullish reversal)
Likewise when the market price makes a higher high and the MACD makes a lower high, it’s a bearish divergence. Expect a possible trend change.
Stochastic forex indicators
Stochastic indicator is a momentum indicator that indicates overbought and oversold conditions.
It fluctuates from 0 – 100%. It is bases on an assumption that closing prices tend to concentrate in the higher parts of the period range in a strong uptrend and near the extreme of low of the period range for a downtrend.
The stochastic calculator has two lines, %K and %D used to indicate the overbought and oversold conditions on the chart.
The default setting for stochastic indicator is 14 periods; it can be hours, days weeks or months.
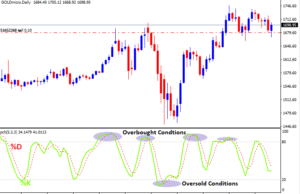
When the reading is above 80%(overbought) and %K line crosses over %D line as both lines are pointing down, it indicates a sell signal.
When the reading is below 20%(oversold) and %K line crosses over %D line as both lines are pointing up, it indicates a buy signal.
The Stochastic indicator can remain above 80 or below 20 for long periods of time, so just because the indicator says “overbought” doesn’t mean you should blindly sell!
The same thing if you see “oversold”, you don’t just buy
You should therefore always use the stochastic oscillator combined with other technical analysis indicators,to get better results. Also add a risk management strategy. Do the same for other indicators
Relative strength index (RSI)
The RSI measures the strength of all upward and downward movements. It also identifies the overbought and over sold conditions on the market chart.
The Relative strength index oscillates from 0 to 100%.
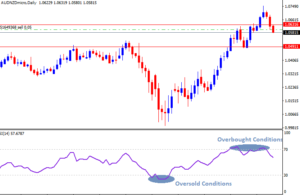
When the RSI reads 70% and above shows that the market is overbought hence bearish reversal. On the hand, when it reads 30% and below, it indicates oversold conditions hence bullish reversal.
Above 70% shows that price is likely to fall and at 30% and below indicates that price is likely to rise.
When
RSI reads greater than 50, it indicates that the upward force is greater than the downward force so it is an uptrend.
Similarly, when it goes below 50 the downward force is stronger than the upward force therefore a downtrend.
How to add oscillators forex indicators on chart
From the top tool bar of your platform,
Look for the indicator list icon. Or else go to insert.
Click on it. It will display a list of indicators, select Oscillators.
Oscillators will display another list of oscillator indicators, choose the one you want and click on it.
A small square will appear on top of your chart, click ok to add.
For instance, suppose you need to use Relative strength index RSI,
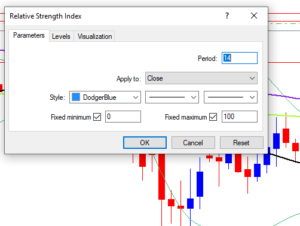
Click Ok to add the indicator. Incase you change your mind, you can click on cancel.
You can also make some changes when the indicator is already on the chart.
To edit the indicator on the chart or delete;
Right click on the indicator
Select delete indicator or edit under properties.
Make sure the indicator brings the name before you right click.
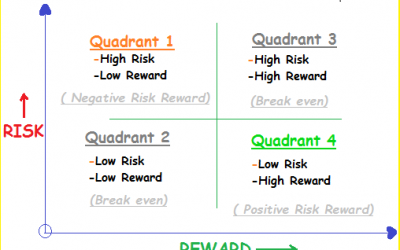
Risk Reward ratio Quadrants: The Difference between Amateur and Professional Traders!
Risk reward ratio (RR) is the “holy grail” of trading. Risk reward ratio Quadrants identify where you actually belong in your trading business. RR is the most important metric in trading and a trader who understands it can greatly improve his/her chances of becoming...
- Oh, bother! No topics were found here.

