Every trader has what they call their ‘bread and butter’ setups. Market Chart patterns or Setups with the highest probability.
But when i find my shock wave pattern within the Wolfe wave, it one of my ‘bread and butter setups’.
Just like the shock wave, there is strong mass psychology in the wave that makes it one of my favorites. You clearly see and feel a shift in the sentiment from buyers to sellers and vice versa.
WOLFE WAVE market chart patterns
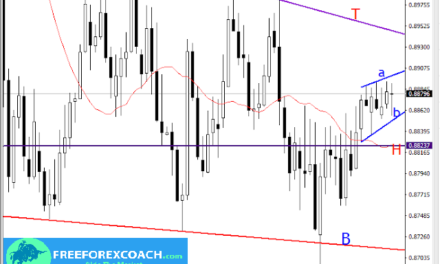
For those of you who don’t know how a typical Wolfe wave looks like:
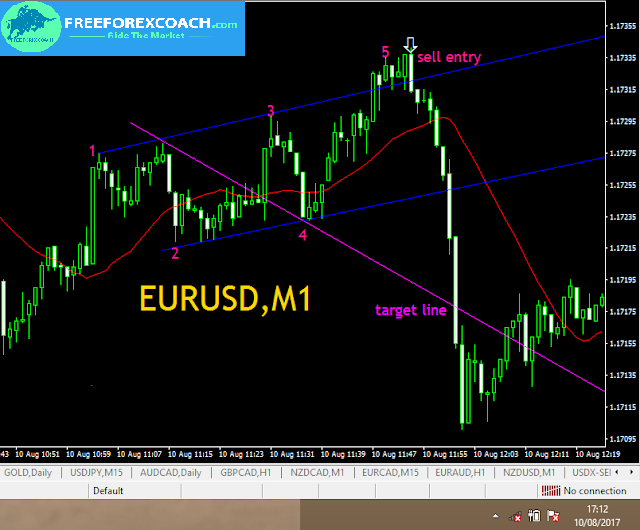
Just like many other chart patterns, it appears on any financial instruments and any time frame.
Example 1: EURUSD, 1 minute chart
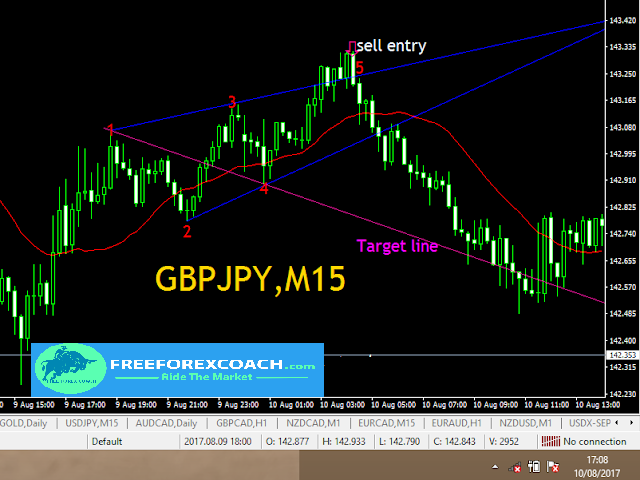
Next Example 2: GBPJPY, 15 minute chart
GBPUSD SHORT FOLLOWUP WITH TRAILING STOP AND NEW ENTRIES
This article was triggered by a lot of bulls who were trapped on the GBPUSD last week.
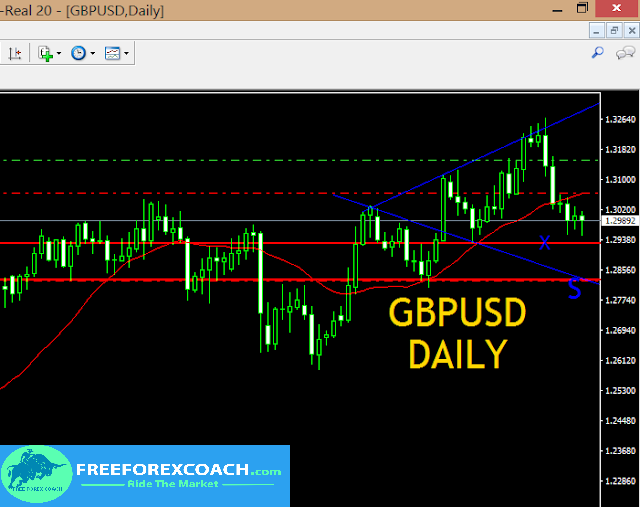
The price had rallied up quite well in the previous days until we saw a wolfe wave being confirmed and triggered heavy selling since last Thursday.
Ok, Lets look at that more in detail below:
DAILY CHART PATTERNS
We are not yet to the target zone, i do think there is more chance for downside despite Trump’s ‘fire and fury’.
4-HOUR CHART
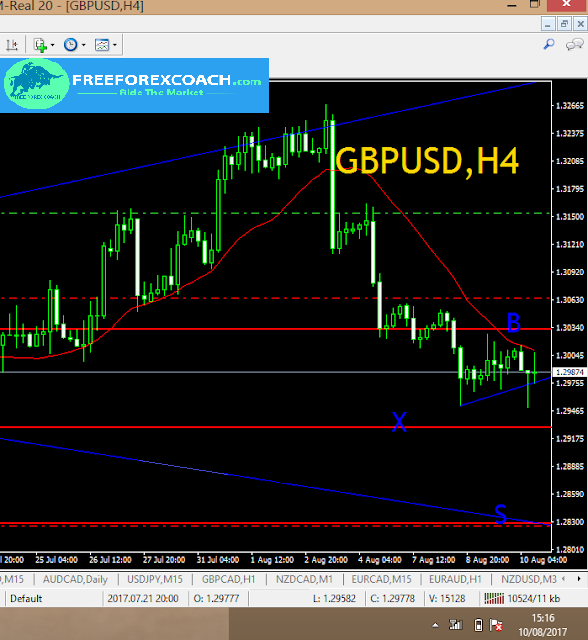
If you you were already in the short like me here with 90 pips with Sl trailed to 1.30609, you may further move your stop to 1.30300 too after confirmation.
BUT in case the PPI news are released and they not good for the USD, Keep the SL on 1.30609 (price where my trailing SL is now), until price hits X.
This is to protect you from the whipsaws caused by news volatility.
When price hits X, you may safely move your stop to 1.30300


