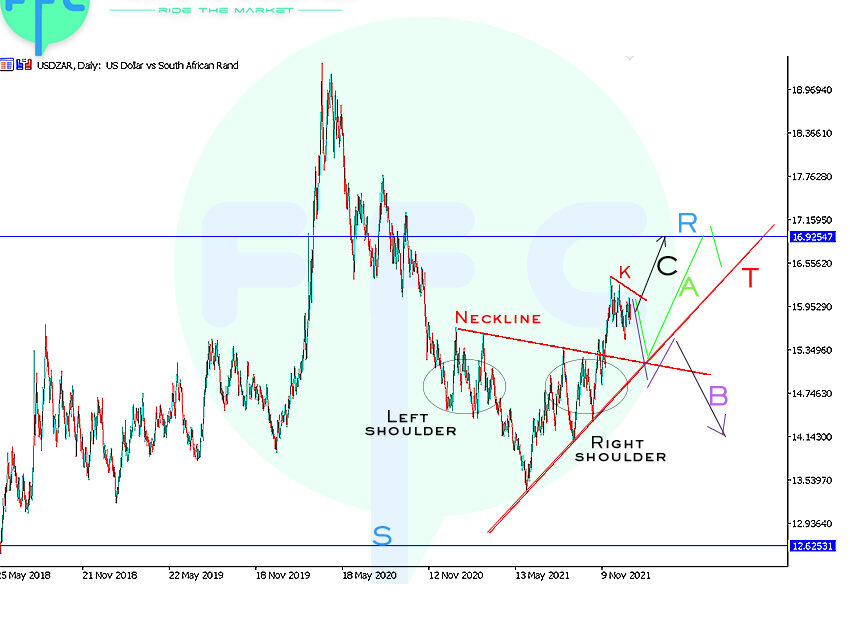
USDZAR Reverse Head & Shoulders on Daily Chart is our point of focus. Take a look at the Daily Chart below;
USDZAR Daily Chart

Looking the chart above, there was a neckline break. So is price completing the pattern up to around 17.0000 resistance zone?
Pro Tip: What makes a Good Head & Shoulders Pattern?
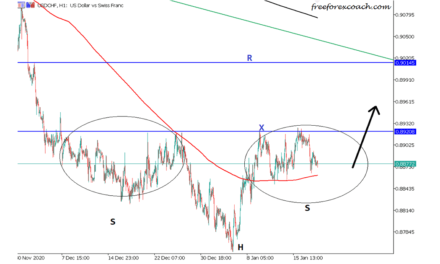
- There must be a trend. In our above chart, we had a good swing down movement into support zone. This could qualify as good trend on smaller time frame like H1
- Right and Left Shoulders should approximately be same size. Here you are looking for balance within a pattern. Just like when you have unbalanced shoulders, movement becomes uneasy so is price.
Therefore time taken to form right shoulder should be almost same as time taken for the left shoulder formation.
Having a balance between shoulders will protect you from unnecessary false break outs
- Neckline doesn’t have to be straight line. Just look for proper line connecting the 2 shoulders if they look almost same size
Let’s see some possible ways price could react at this point;

Reaction A: Price could fall back to retest trendline and then rise again to complete the reverse head & shoulders pattern
Reaction B: The neckline could just have been bull trap i.e false breakout. So price could fall back and break the current trend held by trendline T. React to trendline zone and fall deep into 12.600 support zone market S
C Reaction: Price could now break small trendline K and complete the reverse head & shoulders on the USDZAR Daily chart
Conclusion on USDZAR Reverse Head & shoulders Formation
Right now, drop to 4-Hour Time Frame and watch for possible entries for any of the above reactions (ABC) after daily chart confirmation
17.000 resistance zone is large vital zone for price continuation on the upside or large fall beyond current 13.300 lows support
Keep watch on trendline T. Holding the current trend as correction of the previous downswing or it could a continuation of the overall upward trend.

