In our previous article, we discussed the sell entries and targets. We have seen a swift follow through as price hit our our ultimate target. Congratulations to those who followed up the setup.
So now let’s discuss the current price action on the daily and 4 hour time frame.
DAILY CHART
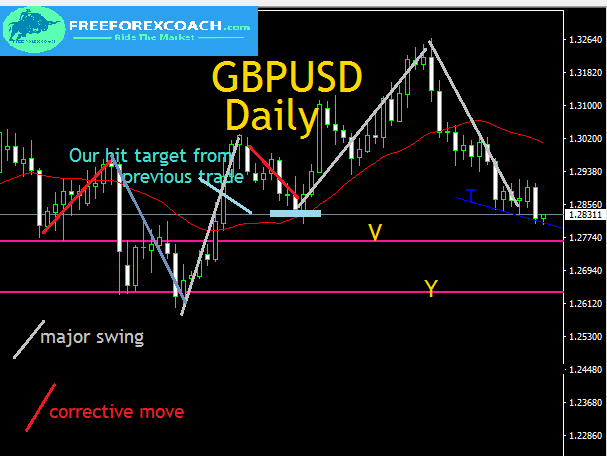
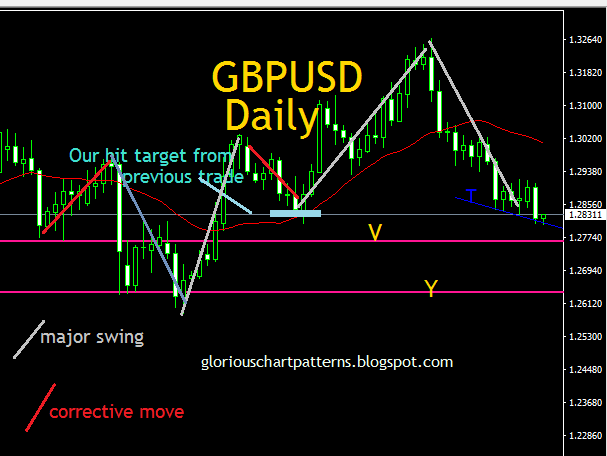
Comparing the current swing with previous major average swings on the daily chart above, before price would have a corrective move, the daily major swing is almost completed.
The downside momentum is still strong so despite the major swing being almost completed, we have no sign of any reversal. If you put a 21 SMA on your weekly chart, you will notice that the weekly price is in the SMA zone support which is also likely to halt the price.
The daily price is sliding along trendline T and also into major support zone but since the momentum on the downside is still quite strong so we may see price go for lower lows.
1.27610 support zone marked V is likely to be the immediate target if price closes below T. Price may fall to 1.26365 support zone marked Y if the momentum stays as strong before we see a significant correction .
4-HOUR
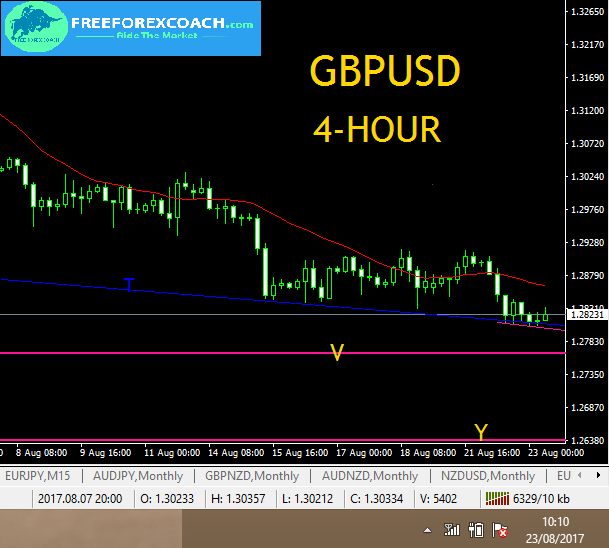
The 4 hour chart like we discussed in our previous article, we use it for entries.
The price is also sliding along trendline support T as shown in the above chart. Close below the small H4 Pink trendline support, may run into support zone marked V as we discussed above.

