
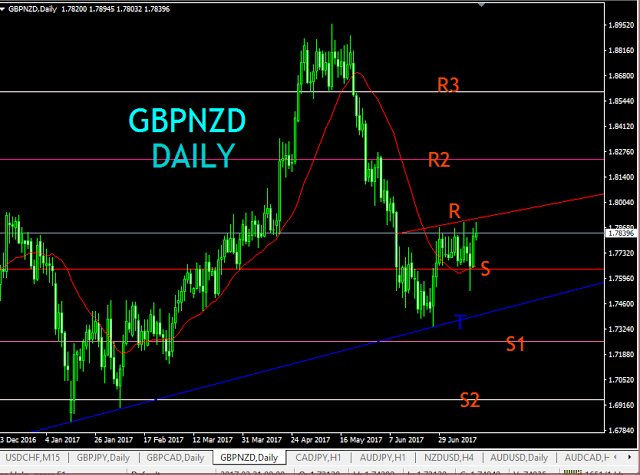
The price is now into a congestion held horizontal support S and red trendline R.
Close below S may lead to first test of major support trendline T before it can fall S1 support zone around 1.72571. Close below S1 zone may to retest of previous lows suppot zone marked S2.
On the other hand, Close above R can lead to test of first major daily resistance around 1.82314 marked R1. Close above R1 zone may lead to retest of the previous high zones around 1.85891 marked R2
NB: On each zone, price has been pausing for a minimum of 5 days before it breaks to new levels. Keep that in mind to avoid false break outs and early/late entries


