To trade harmonic patterns, you must know how it looks like and how it behaves in the market.
Harmonic patterns are hard to spot with your own eyes but once you have understood the trick, it becomes so easy for you to identify and trade them.
The following 3 steps will help you step by step to learn how to trade harmonic patterns.
1. Locating the potential harmonic pattern.
These harmonic patterns tend to look the same by their formations.
So just looking at it, you may not be able to tell which one is a Butterfly or Gartley or any.
But if you can spot it, then you are one step to trading it. The next step will help you learn how to differentiate the different patterns.
Let’s use an example,
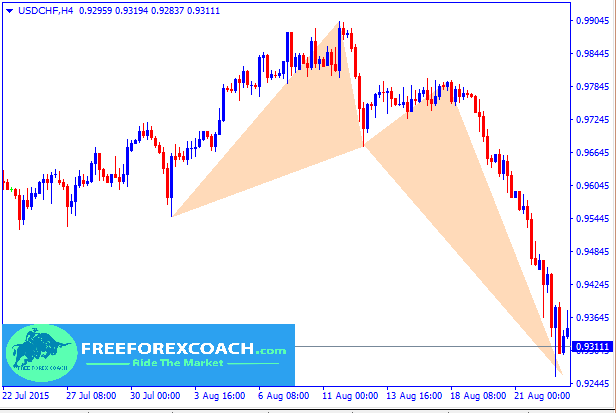
Suppose you spot the pattern below on USDCHF, 4-Hour chart.

2. Identify the potential pattern
The only way to differentiate the Harmonic patterns is to use the Fibonacci measurements.
When you use the Fibonacci retracement and expansion levels, you can tell which pattern is on the chart. It can be a Crab or A-B-C drive or a Bat.
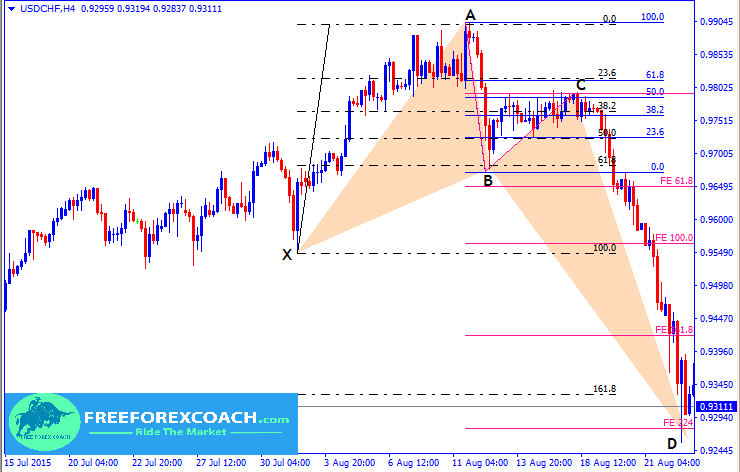
We can now use the Fibonacci retracement and extension to take measurements for the above pattern, so that we get to know what it is.

From the above chart,
XA and AB retracement levels are represented by broken line in black and blue respectively and extension levels are marked by the pink lines.
- Move AB is 61.8% retracement of XA.
- BC is 50.0% retracement of AB
- Move CD is 224% extension of move BC
- CD is 161.8% retracement of move XA.
With these measurements, according to our previous lessons, guess what animal we have. It is a Crab!
Ready to go to the next step.
3. Taking a position/entry
All harmonic patterns are traded the same way. What is important is to wait for the pattern to complete formation and then you take either a buy or sell position depending on the pattern.
In this case we have a bullish Crab pattern.
Therefore we shall take position at the the completion of the pattern. All you need is to wait for the pattern to complete at D and you buy.
You can also use candlestick reversal pattern on the Fibonnacci level for entry confirmation.
For instance in this example,
Now, the interesting part, taking the trade, setting stop-loss and targets.
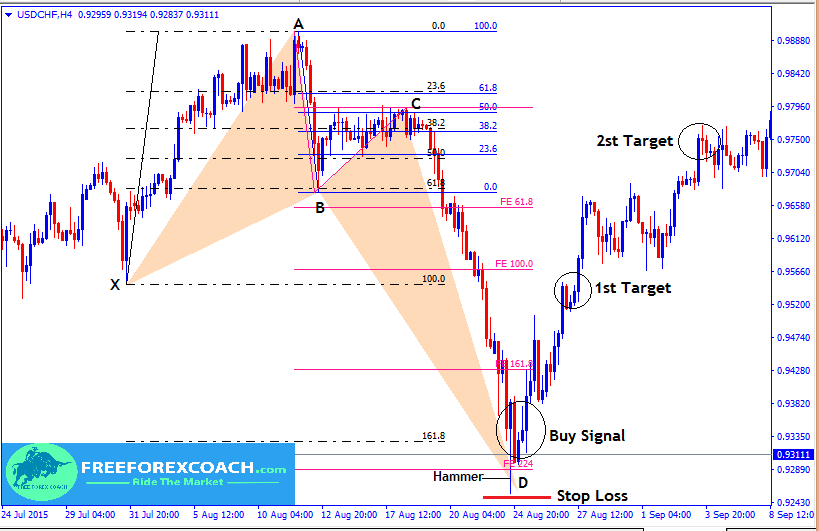
Let’s take a look once more on our example on how this would be done;

From our example above,
the Buy entry signal is at D after Hammer formation.
Our stop loss is just below the Hammer.
The safe target lies within 38.2-61.8% of AD move
. The most important point to ensure is to have a favorable risk reward ratio.
NB. While trading the harmonic patterns, it’s important to recognize the areas of support and resistance and set clear stop and target levels.
Other wise once you have learnt how to spot the real harmonic pattern there are high chances that your target profits will be hit.
It may seem hard at the beginning but with Practice you will be able to grasp them.
How Does Greed Impact your Forex Trading Success?
There are several ways greed can impact your Forex trading success. Firstly, greed can make you abandon your well crafted trading strategy in favor of impulsive and speculative actions. Instead of adhering to predetermined entry and exit points based on technical or...
-
- Topic
- Voices
- Last Post


