
In this AUDNZD Day trading, our focus is on the Hourly timeframe. Picking levels of Support and resistance, exit levels (Stop loss & Take profit) on same time frame.
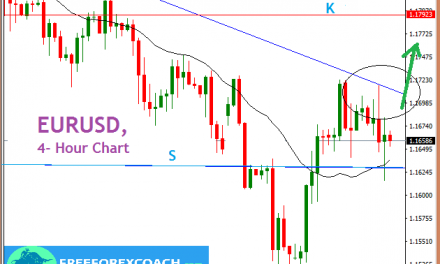
But let’s look shortly at the 4- Hour Chart first
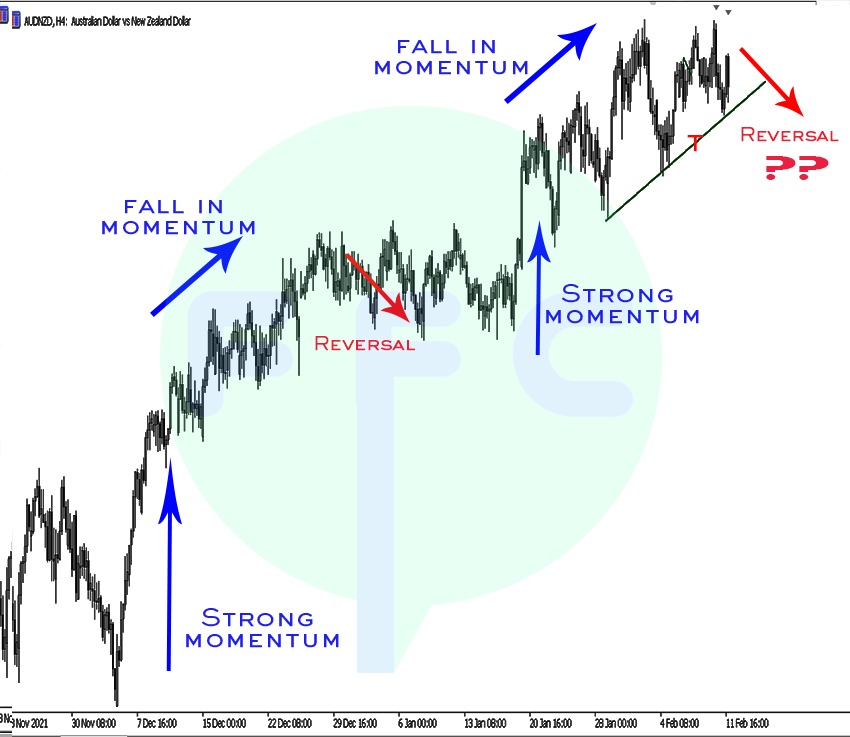
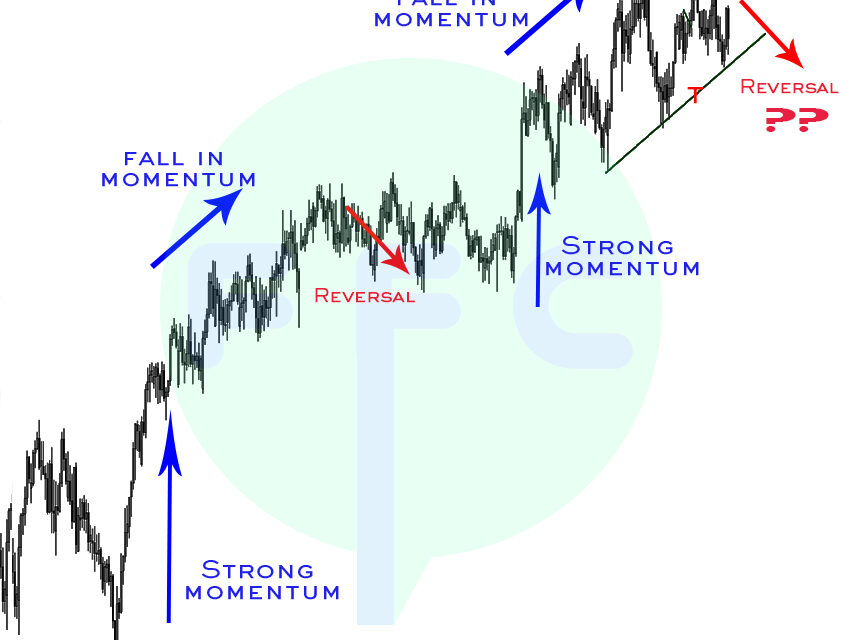
Looking at the 4-Hour Chart above, there is general fall in momentum which could indicate a pending reversal.
Identifying change in momentum helps you gauge bull bear strength, In this case, we had an up trend so a fall in momentum indicates fall in bull strength. So more bears coming in therefore a pending reversal can be expected.
Lets now look at the Hourly timeframe in this AUDNZD day trading.
AUDNZD H1 Chart
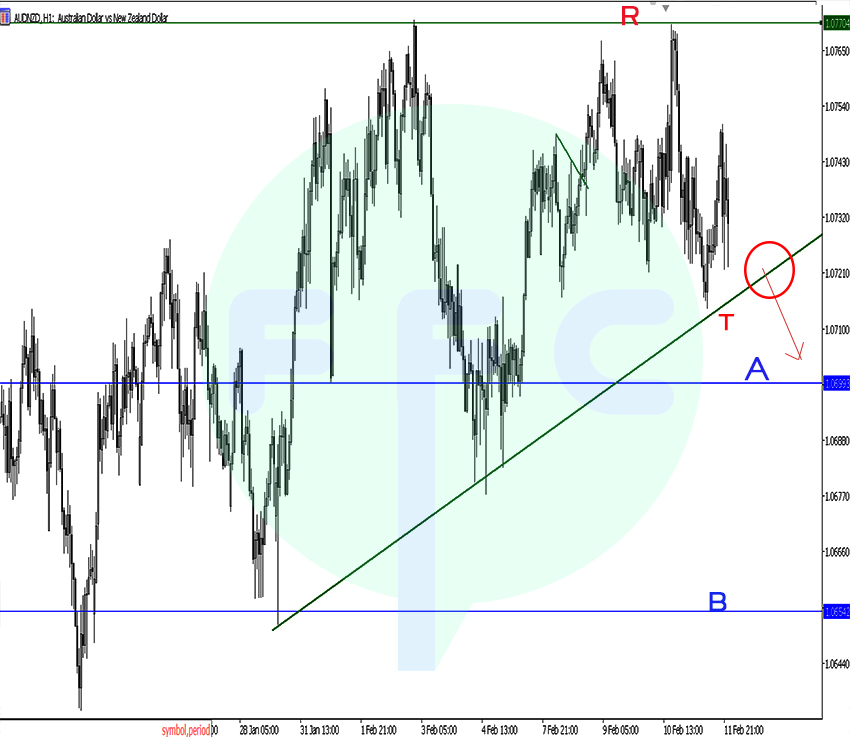
Now we can look at the price action in depth.
Looking at the chart above, the retest on the resistance R gives a double Top formation on this H1 chart. This means if price rises again and goes beyound this zone, the analysis is no longer valid.
We already mentioned the fall in momentum on the 4-Hour chart and now a Double Top formation on the Hourly timeframe. All these point to a pending reversal.
So let’s now look at some levels to watch for confirmation of these day sell trades.
Support Trendline T is holding the current trend at the Double Top completes. Candle break and close below trendline T could see price falll further into support A. Therefore A is the immediate support zone.
Watch for reaction on A for price further fall into support zone.
Conclusion
- Price rising and closing beyond resistance zone marked by horizontal line marked R, invalidates the setup
- Wait for candlestick to actually close below trend line support T not just break or touch
- Proper risk and money management is paramout
Happy Trading!

