
There are interesting Weekly Levels on the EURGBP to keep a close eye on.
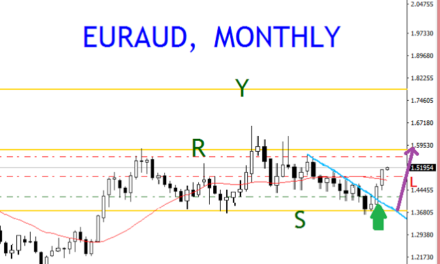
Let’s have a look at weekly EURGBP Chart.
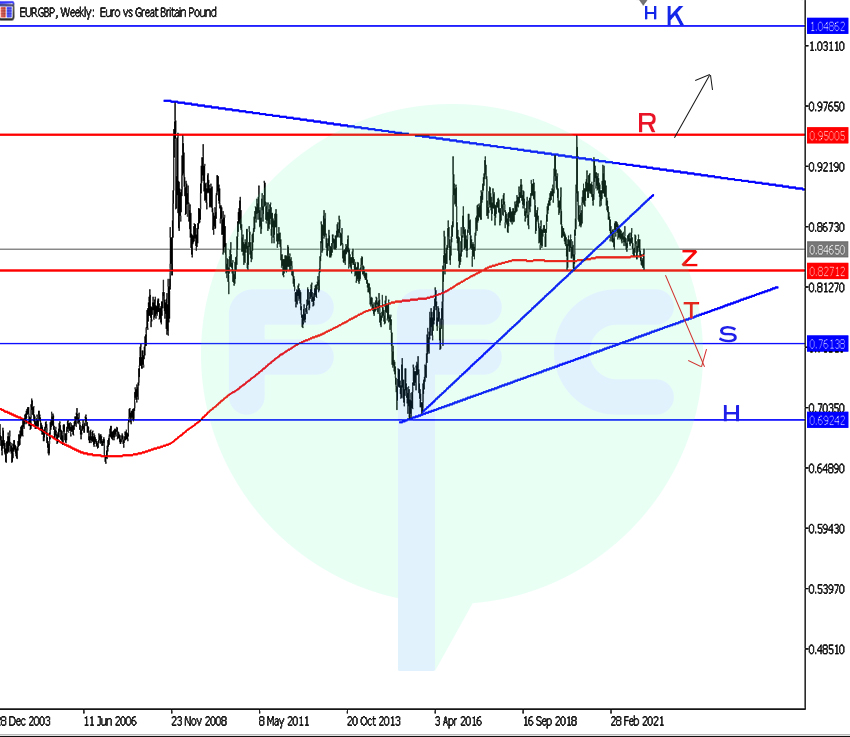
From the chart above, price is still in congestion phase. The congestion zone is held between horizontal resistance marked R and horizontal support marked Z. So these are the levels to keep on the closest eye
Price is currently reacting to weekly support zone marked Z. Weekly candle close below horizontal support zone Z could lead price fall further into trendline support market T. Trendline T zone is same as horizontal line support zone S.
A bearish reaction on this support zone may lead price to fall into larger support zone marked with horizontal line H.
What if price decides to move back up into top part of congestion phase resistance zone marked R?
In this case, watch weekly candle close above R resistance zone. Immediate target resistance would be resistance zone marked K
Let’s look at a smaller time and see what is going on in the price action;
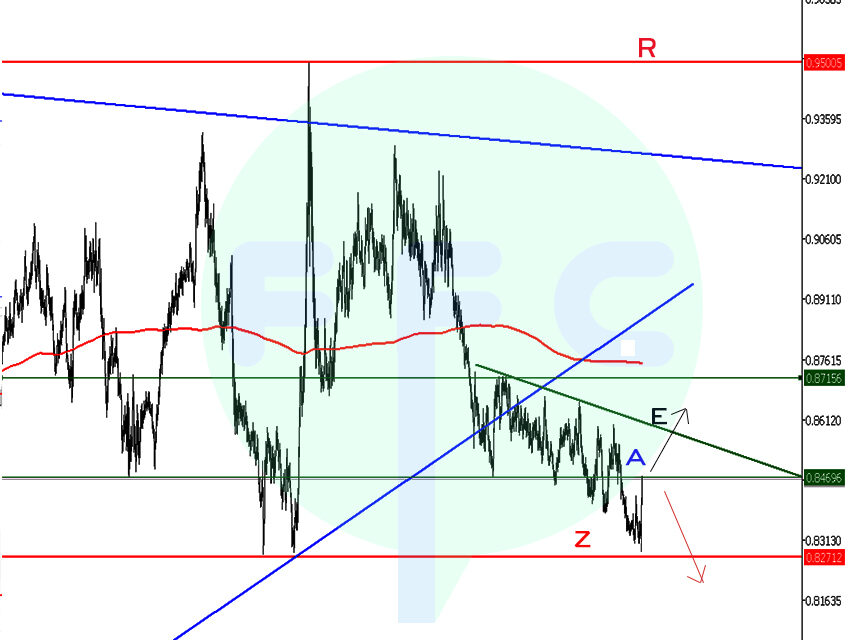
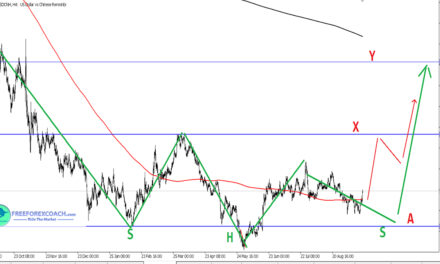
Daily EURGBP
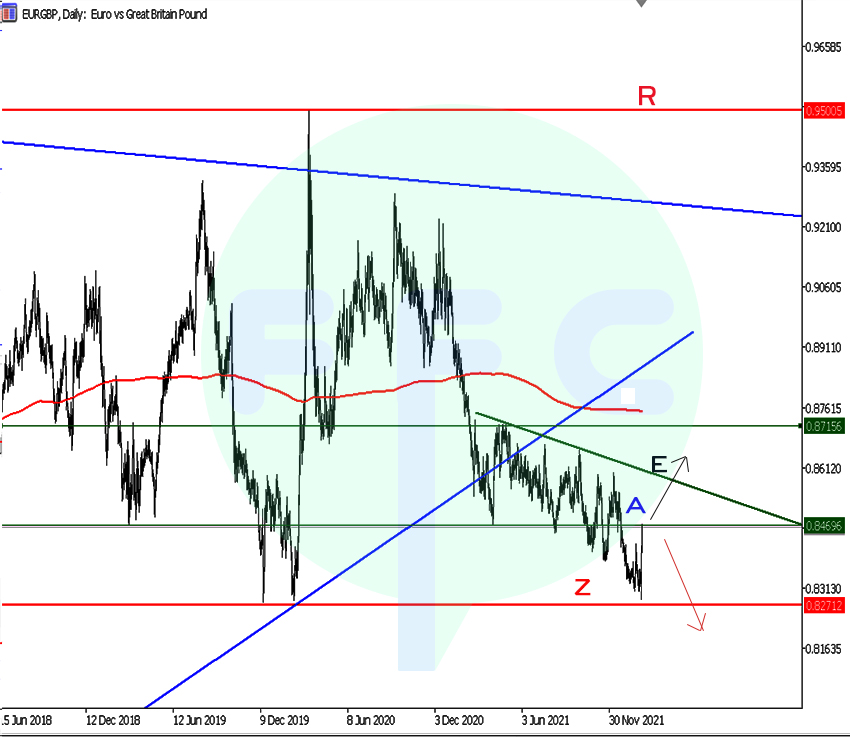
On this Daily EURGBP chart, price is into same daily resistance A, a reaction off this could push price higher into small trendline E resistance. A good reaction on this could lead price higher into immediate daily resistance Y.
After this zone, focus returns to the weekly levels on EurGbp chart. Therefore next level to watch would the trendline resistance H and then end of congestion phase resistance zone marked R.
For the downside movement on this Daily chart, confirmation better on the weekly chart. This means that it’s important to wait for weekly candle close below support zone Z.
Conclusion
Weekly levels on EURGBP to watch closely right now is R and Z zone to determine the next big movement. Weekly candle must actually close beyond the levels.
Happy trading!!

