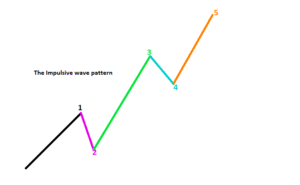
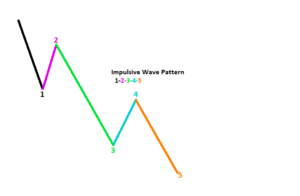
The Wave Impulse Structure in Elliot Theory is a 5 wave Pattern.
Previously, we saw what an impulsive wave of the elliot wave is.
Now, we shall take you through the main characteristics of the impulsive wave specifically each wave pattern.
5 wave Impulsive structure in elliot theory
Wave Impulse Structure in Elliot theory comprises of waves 1,2,3,4,5.
Of the 5 waves in the pattern, wave 1,3,5 are the motive waves, meaning they move in the direction of the main trend.
Similary, Waves 2 and 4 are the corrective waves. These move in the opposite direction of the main trend.
Example of an Impulsive wave.


Let’s now dig in and look at each wave impulse structure in Elliot theory formation in details.
Wave 1
At this point in the market a few buyers believe that the price is going to increase.
As others are still held by doubt, these traders decide to take advantage of the cheap prices in the market and risk to place a buy.
Wave 1, is a leading wave and can sometimes be slow or sharp depending on the traders position. As traders take their positions, prices continue to rise
This wave can further be sub divided into 5 smaller waves.
Wave 2
Wave 2, is the first corrective wave of the impulse pattern.
It can be sub divided into 3 smaller waves and is often sharp and deep retracing much of the gains of wave 1.
At this point, some traders are still convinced that the previous trend is still in its direction.
Therefore, as they hold on to their short/sell positions,price retraces back most of the first wave shaking off the risk averse buyers.
However, price never completes the retracement to 100% of the first wave. If it goes beyond, then the wave becomes invalid. Start on anew count.
Wave 3
Wave 3, also comprises of 5 smaller waves and is the longest and most powerful wave.
The market is now clear as more buyers engage in the trade. As more traders buy the stock, prices continue to go higher till it reaches a point where it is rejected.
By rule of thumb, wave 3 is never the shortest among the 1,3,5 waves of the pattern.
It is illustrated on the picture above in lime green color.
Wave 4
Wave 4, is a correction of wave 3. Prices are reaching the price peak.
In this case, some traders take advantage of the situation and sell off their positions at high prices to grab the high profits.
Wave 4, is a very complicated wave and often difficult to identify. This is because buyers are still strong in the market and still positive.
This wave can never move into wave 1.
Wave 5.
At this point the price has tested its higher highs and the traders are in the climax of their session.
The stock is being overbought resulting into further increase in its price.
The high prices may as well be as a result of a speculative bubble in the market towards that currency or stock.
The investors may exaggerate the expectation of the future growth of the stock or appreciation of currency. This will push prices high beyond the actual value due to increased demand.
Wave 5, marks the end of the impulsive wave and the next corrective move begins the corrective wave pattern.
After a very sharp rise in price, we expect a spike downward move.
The 5th wave usually displays the weakening of the trend as it forms tops and bottoms.
This is because,
As more and more buyers get in the market, the demand exceeds supply leading to very high prices.
As a result, some traders start to panic and sell off their stocks when prices are still high.
Prices fall back and the corrective wave pattern a,b,c starts to form.
How Does Greed Impact your Forex Trading Success?
There are several ways greed can impact your Forex trading success. Firstly, greed can make you abandon your well crafted trading strategy in favor of impulsive and speculative actions. Instead of adhering to predetermined entry and exit points based on technical or...
-
- Topic
- Voices
- Last Post


