Trading with pivot point is at most the same as trading with support and resistance. Pivot points are as support and resistance levels except that are calculated using the open, high, low, and close of the previous trading day.
Like the support and resistance, when price approaches the pivot levels, it tends to reverse. This gives you an opportunity to generate trade signals on reversals. However, this may not happen all the time.
Price may also break the pivot levels . It happens sometimes. Therefore you must always keep your fingers crossed and react only when you get a confirmation signal.
let’s now dive in and see how to generate trade signals when price is ranging/ in congestion.
How do you trade with Pivot Points in Ranging Markets
In a ranging market, price moves between a boundary of support and resistance levels. It forms high and low curves on the pivot point levels.
Mean while, these points tend to behave like the levels of traditional support and resistance. In addition, since most traders watch these levels all the time the prophesy tends to come true.
In other wards, the best way to trade pivot points is to treat them as normal support and resistance levels.
Price moves up and down in a wave hitting both the support and resistance levels as it makes pivot points. This gives you more opportunities to buy or sell as it reverses back from the support or resistance levels.
Like any other indicators, trading pivot points with other indicators helps you generate strong signals to trade.
For instance, you can combine the pivot point with reversal candlestick patterns when trading bounces. This additional confirmation gives a strong entry signal.
Then place your stop-loss just below or above the entry point. The immediate pivot level zone becomes the immediate target.
Let’s take a look at the example below on the EURJPY with Daily Pivots;
Trading with Pivot points on the EURJPY Chart
On the chart below we have a range market. It is ranging between Daily Pivot and Daily S2. So these are the levels of our interest.
We shall have a (Buy &Sell) entry after a clear candlestick reversal formation. Take the next pivot level as the immediate target which in this case is Daily S1.

From the above EURJPY chart;
Buy 1 is a bounce off the pivot level support (Daily S2). The Bullish engulfing candle confirms our trade entry. The stop-loss is set just below the candlesticks.
Buy 1; Target 1 is the immediate pivot level resistance( Daily S1).
Sell 1 is also a bounce off the pivot level resistance (Daily Pivot), the Shooting star gives confirmation. The stop-loss is set just above the candlesticks and the target (Sell Target 1) is the immediate pivot level support( Daily S1).
Buy 2 is a bounce off the pivot level support (Daily S2), the Hammer reversal patterng gives confirmation. The stop-loss is set just below the hammer and the target (Buy Target 2) is the immediate pivot level resistance( Daily S1).
Sell 2 is a bounce off the pivot level resistance (Daily Pivot) confirmed by the Shooting stars. The stop-loss is set just above the Shooting star and the target (Sell Target 2) will be on the immediate pivot level support( Daily S1).
Trading Breakouts with Pivot points
Like support and resistances levels, pivot point levels can never hold forever. Price will at one point violet the prophesy and breakthrough.
As you are always on watch, you can also take advantage of the breakouts on these levels and make a profit. A rule of thumb, break out trades perform best on trending markets.
Let’s look some examples below;
Example 1
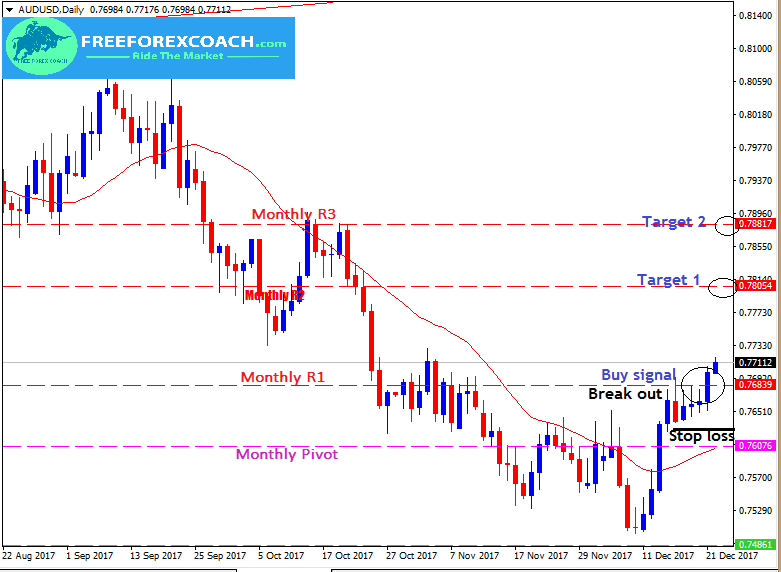
The chart below is AUDUSD, Daily with monthly Pivots.
Price paused as it approached the resistance zone on Monthly R1. Then we see a nice bullish candle break out and close above R1. This confirmed buy signal (Buy1).
Stop loss is just below the previous candlesticks and the Profit target is the immediate next pivot level. In this case, the target is the R2 resistance zone (Target 1).
In case we get another strong bullish breakout to upside on Monthly R2, then the target will be Monthly R3 (target 2)

Let’s take a look at the another break out example
Example 2, Pivot Point Breakout
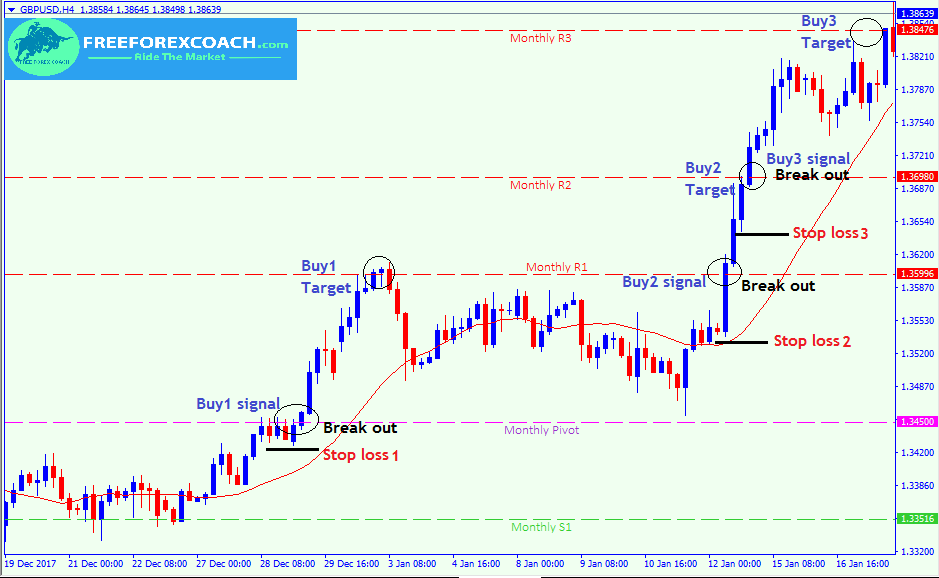
This is very clear and pretty simple to make profit out of. GBPUSD, 4-Hour chart.
From the chart above, the price was trending upwards.
Like we mentioned before, pivot break out trades perform best in trending markets. Let’s look at the chart first;

The first buy (Buy 1) was due to a bullish candle close above the Monthly Pivot. The Stop loss is just below candle sticks and target is the immediate next pivot resistance (target 1) on Monthly R1.
Note that, it similarly looks like that Buy 1 signal on Example 1 above with a small pause on pivot resistance before actual break out.
Buy 2 is a strong break out above Monthly R1. Stop loss is just below and profit target is the next immediate pivot level resistance zone, Monthly R2( Target 2)
Buy 3 is also a strong break out above Monthly R2. Stop loss is just below and profit target is the next immediate pivot level resistance zone, Monthly R3 ( Target 3)
How Does Greed Impact your Forex Trading Success?
There are several ways greed can impact your Forex trading success. Firstly, greed can make you abandon your well crafted trading strategy in favor of impulsive and speculative actions. Instead of adhering to predetermined entry and exit points based on technical or...
-
- Topic
- Voices
- Last Post


