To successfully trade divergences in Forex, first you have to know how to differentiate the different types of divergences in the market.
We will cover examples on RSI, MACD and Stochastics divergences
For instance,
When you spot a higher high than the previous high on the chart, the first thing to do is to look down on your indicator to see what it says.
If they disagree, then there is a bearish divergence.
When you spot a double or triple tops pattern form on the market chart.
Join the tops together with a trend line connecting the two tops.
The last top should be slightly lower than the first top.
Do the same on the indicator you are using below the market chart.
How do you identify divergences on the MACD
In case you are using a MACD, watch the histogram tops and bottoms.
The MACD is a moving average convergence divergence indicator where a signal is taken on a crossover.
When you trade the MACD the divergence, your entry should be at the crossover of the histogram above or below the zero line.
Now let’s look at different examples when using different momentum indicators to trade divergences in forex.
Trading divergence on the MACD
After spotting a divergence between price and the MACD, wait for a confirmation on the MACD histogram crossovers with the zero line
Example 1. Regular Divergence
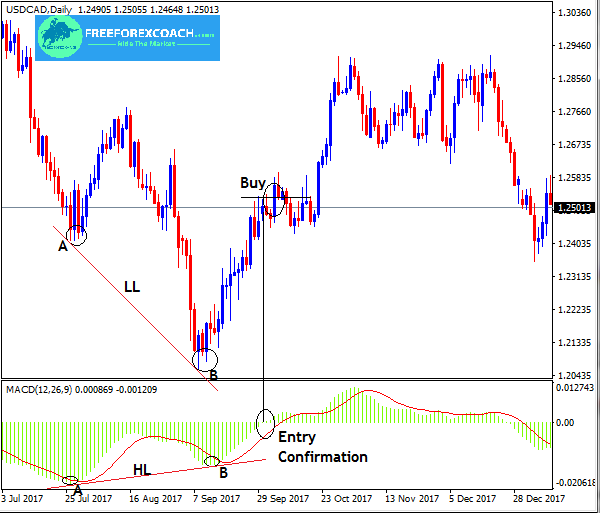
The chart below shows how to trade divergences in forex using a MACD indicator.

If you can take a good look on the chart above,
You will notice that the USD/CAD daily chart closed with a lower bottom/low. At the same time, the MACD made a higher bottom/low.
This indicates a bullish divergence between the price action and the (MACD) indicator.
This is a good opportunity to take a long position on the pair. As a matter of fact, you can see how the USD/CAD moved upward after the divergence scenario.
It is always important to wait for a confirmation by the MACD crossovers as circled on the chart above to avoid being faked out.
Follow the same procedure to trade any type of regular divergence when using a MACD.
Example 2: Hidden Divergence
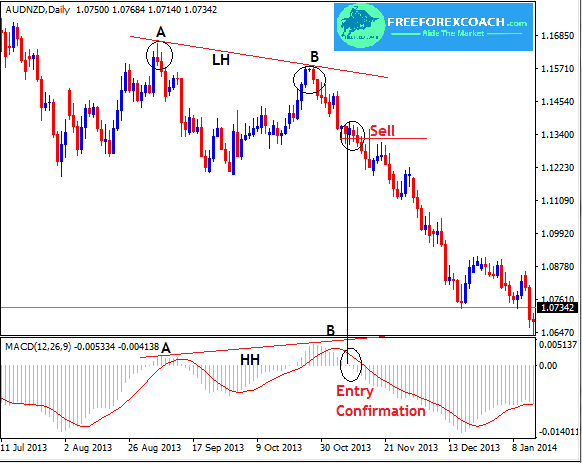
Let’s look at a second example when trading a hidden bearish divergence with a MACD.

The oscillator strikes higher high but price forms a lower high or maintains its previous point.
The trend is still strong and continues in its direction after the completion of the consolidation.
Trading divergences when using Relative Strength Index(RSI)
The Relative Strength Index is also a momentum indicator that measures the overbought/oversold price conditions in the market.
The RSI indicator is a leading indicator and consists of a single line, which moves between an overbought and oversold zone.
Apart from showing overbought and oversold conditions, the RSI chart is to identify trading signals as a result of divergences between price and RSI.
When you spot a disagreement between price action’s tops or bottoms and RSI’s tops or bottoms, it means a divergence pattern is forming.
Once you get hold of the pattern, you can prepare for a price reaction depending on where the pattern is. It’s either a bullish divergence or a bearish divergence.
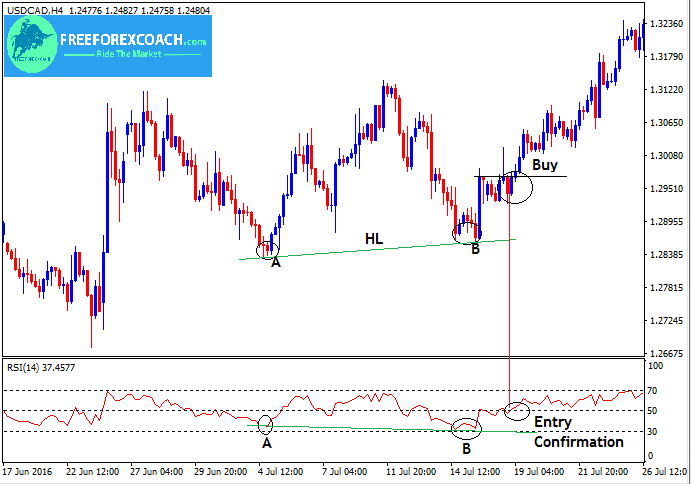
For example, let’s take a look on how to trade divergences in forex using RSI below.

From the above chart, price has been moving in an uptrend till it started forming higher lows.
If you can take a good look at the momentum indicator, RSI;
it’s second low is at the same level as the first. Its shows a disagreement between price action and the RSI indicator.
This is known as a hidden bullish divergence.
We therefore expect price to continue moving in its initial direction after that small pause in the market.
This was further confirmed when RSI indicator crossed over above the 50 indicating a strong uptrend ahead .
This is good to rely on for our entry confirmation as marked on the chart.
Trading divergences when using a stochastic oscillator
The Stochastic oscillator consists of two lines which interact frequently between each other. It also shows over bought and over sold conditions.
The Stochastic indicator works the same way as the RSI indicators and the only difference is the fluctuation levels and formation.
It can also be used to identify divergences in the market.
Divergences with Stochastic, behave the same way as with the MACD and RSI.
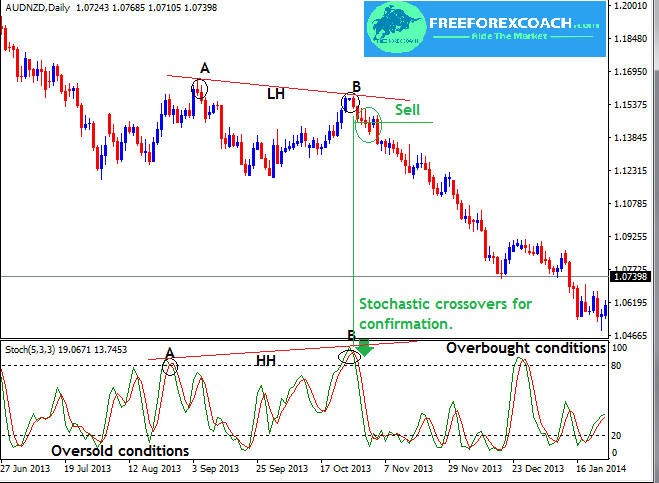
The chart below shows how to trade divergences in forex using the stochastic oscillator.
Take a look

From the above,
Chart price action made a lower high from A to B and at the same time the indicator made a higher high form A to B.
This shows a disagreement between the price action and the stochastic indicator. Which calls for a divergence signal.
Since the stochastic indicator closed its high in the over bought zone, this means that AUD/NZD has been overbought. Therefore we should expect a future price fall.
When the stochastic lines crossover within the overbought zone pointing down, it gives a strong signal confirmation that we should short the pair.
A strong downtrend movement is likely to occur after the cross below the over bought zone.
Carefully study the chart above.
Let’s do a small recap on types of divergences in forex market
Types of divergences
Regular Divergence
A regular divergence in an uptrend or downtrend signals a possible reversal from the previous direction.
Prepare to either enter or exit trade position.
A regular divergence is a reversal pattern. Price makes lower lows/higher highs and the oscillator makes higher lows/lower highs,
Hidden Divergence
Hidden divergence necessarily means that a trend is getting ready for a pause or consolidation.
There after it will continue to its direction after a pause. It is a continuation pattern.
The oscillator makes higher high/lower lows but price forms a lower high/higher lows or maintains its previous point.
Exaggerated Divergence
For exaggerated divergence you can choose to open new positions by scaling or trailing the already open positions .
It is both a continuation pattern and a reversal pattern.
Price forms tops or bottoms on the same line while the oscillator forms a lower low top or higher bottom.
As the indicator makes higher highs or lower lows and price fails to respond, it is an indication that the trend is likely to reverse. or get in a consolidation.
How Does Greed Impact your Forex Trading Success?
There are several ways greed can impact your Forex trading success. Firstly, greed can make you abandon your well crafted trading strategy in favor of impulsive and speculative actions. Instead of adhering to predetermined entry and exit points based on technical or...
-
- Topic
- Voices
- Last Post


