So, how can we use Fibonacci Retracement to enter trades??
Now that we know what Fibonacci is, lets dig deep in to how to use them to enter a trade.
As earlier mentioned, Fibonacci retracement can be used to determine entry points for trades & to make trading strategies.
Moreover, the Fibonacci retracement levels work best when the market is trending. That is either in a downtrend or uptrend.
When trading with Fibonacci retracements, you should always aim at trading in the direction of the main trend.
When to buy or sell using fibonacci retracement
If you are to use fibonacci retracement to enter trades in an uptrend;
Buy when the price pull back holds or bounces back on any of the Fibonacci retracement levels in the main trend direction.
Place a stop loss just below the price low or below the lower Fibonacci retracement level.
Similarly,when yo are to use fibonacci retracement to enter trades in a downtrend;
Sell when the price pull up holds at any of the Fibonacci retracement levels. Or else, when it bounces back to the main trend direction.
Place a stop loss just above the price high or above the higher Fibonacci retracement level.
This simply means that to trade the Fibonacci retracement levels, we have to treat them as support and resistance levels.
- That is, buy low when price bounces off the retracement level after a pullback when in an uptrend.
- Or sell high when price bounces of the retracement level after a pullback when in a down trend.
You can also take advantage of Fibonacci breakouts by selling when price breaks the Fibonacci level when in a down trend. On the other hand, you can buy when you notice a break out on the fib level in an uptrend.
How to use fibonacci retracement to enter trades on a price swing
Like we said before,to draw Fibonacci retracements, You need to pick a swing low and swing high. Then connect the two with the Fibonacci retracement tool.
Let’s say you want to use fibonacci retracement to enter trades in a downtrend;
- First, you need to pick a strong down swing with a potential pullback.
- Pick the Fib retracement tool from the tool bar on the platform and draw from the high of the swing to the low of the swing.
- Then check your levels to Identify where price is likely to hold after a pullback from the main trend for monitoring.
- Wait for a correction/bounce that points on the downside before taking a short position.
The commonly watched levels are 38.2%,50.0% for a strong trend and for a weak trend you can consider 61.8% Fibonacci retracement level.
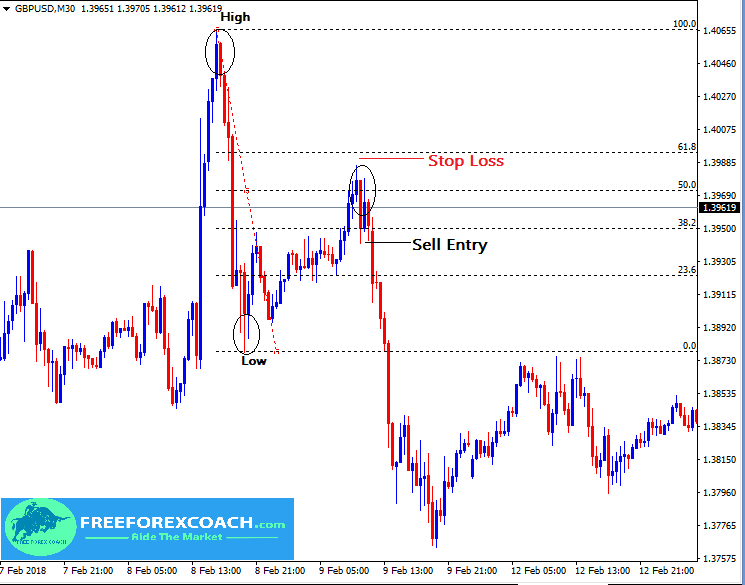
Let’s take a look on the chart below.
Fibonacci retracement in a downtrend
The chart below shows how price continued fall strongly after retracing the Fibonacci level 50.0% on GBP/USD.M30 chart.

As price continued to drop after the high;
it hit the 0.0%level and closed with a long pin bar showing strong rejection on that level.
It made a pull back from the 0.0% Fibonacci level, held shortly at 23.6 level and hit the 50.0 level.
At this level, it bounced back with a large bearish candlestick engulfing the small bullish candlestick.
This gave us a signal for a strong down move a head. The formation of the next bearish candlestick gave confirmation for a Sell entry.
After retracement, the price continued to fall strong and if you had taken this trade, you would make yourself clean profits.
Stop loss should be set slightly above the high as indicated on the chart above.
Target profit can be adjusted as you watch the next Fibonacci levels below your entry point.
Now let’s see how to use Fibonacci retracement tool when in an uptrend.
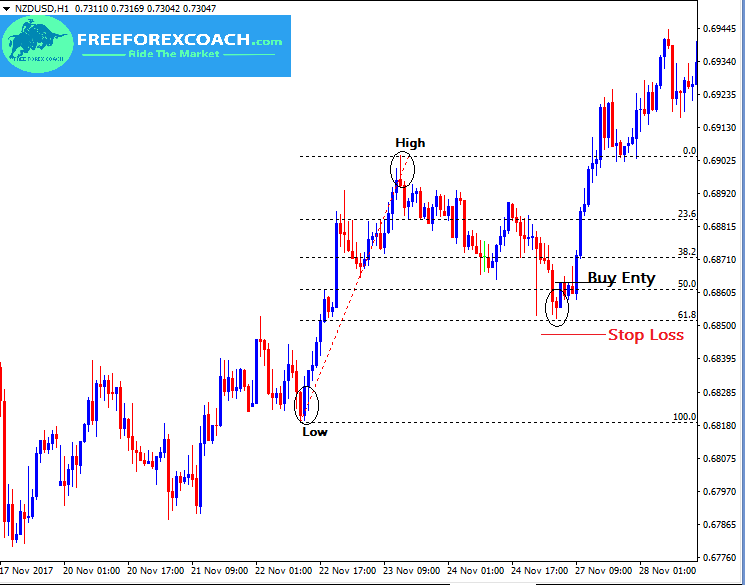
using Fibonacci retracement to enter trades in an uptrend
NZD/USD,H1 chart with Fibonacci retracement tool

After the swing high;
Price made a pullback and held at the 23.6, 38.2 bounced off shortly at 38.2 fib level. Here it gave a fake buy signal. Therefore, if your entry was here, your stop loss would be run-over.
Price stretched down and finally retraced level 61.8. At 61.8 level, it formed a strong candlestick pattern identified with the black circle that gave a reliable signal .
The formation of a small correction gave confirmation for a buy entry with a bullish candlestick closing above the 50.0 level.
Stop loss should be slightly below the low as indicated above.
Points to note as you trade fibonacci retracement
Trading Fibonacci levels may not be that easy as it appears, it also has its own short comings and can also give fake outs in the market sometimes.
For instance, looking at the above chart,
if we had taken a buy position as price bounced at level 38.2, our stop loss would be hit and we would miss out on the strong movement that occurred after retracing the 61.8 level.
It is always important to wait for a correction after reversal from the fib level before taking any position to avoid fake outs.
Or else you can use strong reversal candlestick patterns as your additional confirmations. Such as engulfings, stars,doji to mention but a few.
It is also important to note that; not all the time these level will hold or price will always bounce off these levels. It can break the level or fails to reach it. But this doesn’t mean you can’t make profits trading the Fibonacci level.
Choose 1-2 levels to which you will base your analysis on and trade only that.
For example you can choose to watch level 38.2, or 61.8 or 50.0 and trade only when price bounces off any of these levels.
You should also consider using other technical analysis tools such as candlestick patterns, momentum oscillators and trend indicators to confirm your signals.
In the next lessons, we shall see how to combine fibonacci retracement with other tools to improve your profitability
How Does Greed Impact your Forex Trading Success?
There are several ways greed can impact your Forex trading success. Firstly, greed can make you abandon your well crafted trading strategy in favor of impulsive and speculative actions. Instead of adhering to predetermined entry and exit points based on technical or...
-
- Topic
- Voices
- Last Post
- Registered Users
- 5,560
- Forums
- 7
- Topics
- 18
- Replies
- 42
- Topic Tags
- 1


