In one of previous articles, we discussed why the crypto boom is likely to bring back investors to the centuries safe havens i;e Silver and Gold. We also talked about why silver is likely to be a better investment than Gold. If you missed the article, you can get it here
So now lets look more into the price action on the silver weekly chart.
WEEKLY CHART
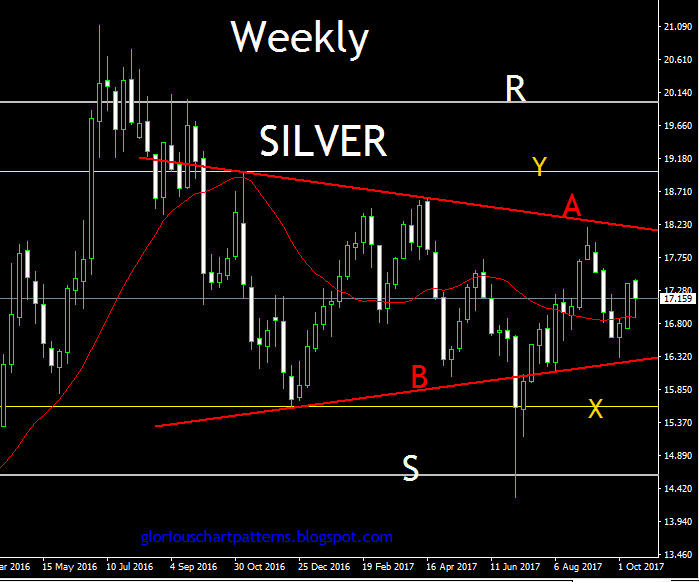
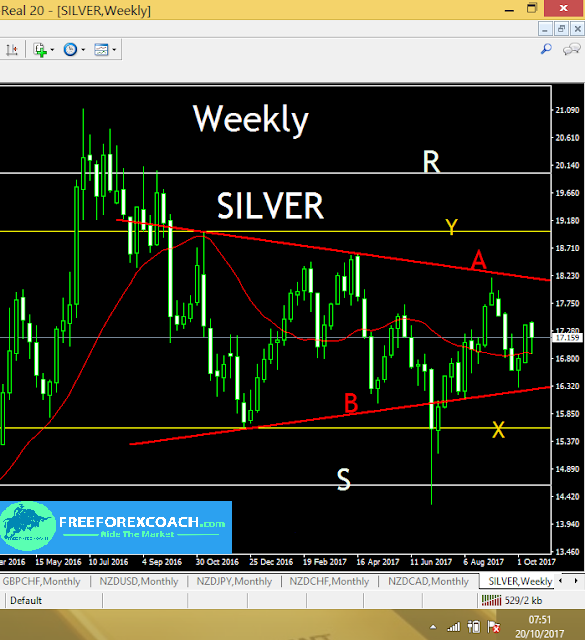
Price on the weekly chart is into congestion triangle showed by red trendlines A and B. The large monthly chart is into a large support which explains the large congestions on the weekly chart.
Silver price is coming towards end of triangle without breakout, so may see immediate levels of support X around 15.600 and resistance Y around 19.000 , hold before momentum can build to hit the ultimate levels S and R respectively.
For now keep the trading within the triangle congestion.
Weekly candle close above A may lead price into Immediate resistance Y and depending on the reaction on the Y zone we may see price push to large resistance marked R around the 20.000 zone.
Weekly candle close below B may lead price into immediate support X and depending on the X zone reaction, price could retest lows at 14.600 zone marked S
The large monthly chart already shows some bullish bias, so preferably price has to stay above support trend line B to maintain the bullish bias. If the upward bias is maintained and we get prices hitting resistance R, a monthly candle close above the zone R may give a long term monthly swing on the upside.
We still in congestion now, so we will wait for price action on the major marked support and resistance levels.

