In this lesson, we shall summarize all that we discussed previously on forex breakouts and false breakouts / fake outs.
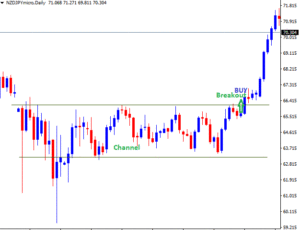
A price breakout occurs on the defined psychological price levels in the market.
They include; support and resistance levels, trend lines, price channels, moving averages, Fibonacci retracement levels, pivot points and chart pattern.
Breakouts normally occur after a long price consolidation or several test of price on the levels of support and resistance or at end of price trend.
Ok, let us now start the forex breakouts and false breakouts summary
How do you trade forex breakouts summary
You can trade breakouts in 2 ways;
- Immediately after the breakout. Entry is at the close of the confirmation candle that makes a breakout. Exit when the volatility dies out (aggressive trader).
- Wait for price retest on the break out level. Enter trade on the second confirmation (conservative trader). Exit when volatility dies out.

However, if you trade a breakout on the major price patterns, like triangles, look at the height of the pattern and use the same to set your target level/Exit.
Your risk reward ratio is important to consider every time you decide to take a trade.
For a strong breakout strategy, consider longer price consolidation and breakout volatility.
What is volatility in the forex market
Volatility is the rate at which the market moves.
When there is a very strong price movement within a short time after a break out, we say the volatility is very high.
With high volatility, there is higher chance of your targets to hit with in a shortest time possible.
On the other hand, when the price is moving steadily slow or looks like it is not moving at all, then the volatility is low. T
his reminds you not to set your targets very far from the entry level because with low volatility price is likely not to move very far.
A breakout is sometimes followed by a small price retrace resulting from the abrupt shift in the supply and demand as it seeks to re-balance.
A continuation after that small retest is a strong confirmation that price will cover several movements before retracing back.
High volatility can still expose you to very high risks therefore before taking any decisions you should have good risk management in place.
How to measure volatility in the market
Here are some of volatility indicators you can use to gauge the state of market and to know the strength of the trend, possible breakouts and potential market reversals.
The Average True Range (ATR)
ATR measures volatility by showing the average trading range of the market for a given period of time.
It grows along with volatility and falls with it.
When ATR is rising, it shows that volatility is also rising whereas when it is falling it is an indication that volatility is dropping down.
Bollinger bands
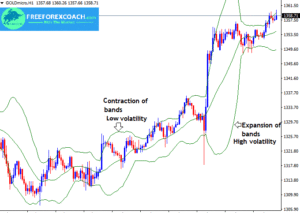
The bands move along following price and normally contract when volatility is low and widen when volatility is high.

On contraction, low volatility.
Expansion, high volatility
You now know how to trade breakouts and how to measure market volatility.
Let’s now look at different types of breakouts you can trade.
Types of breakouts
Continuation break outs
A continuation breakout results when price is ready to continue in its direction after a small pause or consolidation.
Reversal breakouts
This comes after the exhaustion of the trend or consolidation. This is when the currency has moved in one direction for a long time and has attained its overbought and sold conditions.
Price breaks out as it reverses direction.
How to identify breakouts?
Break outs are common at;
- Support and resistance levels
- Channels
- Trend lines
- Triangles
- Chart patterns and using indicators.
When trading breakouts, it’s possible to gauge the strength of the breakout before you take a trade. indicators like MACD and RSI can help you gauge strength
Moving average convergence divergence MACD
The MACD histogram shifts in size when there is a change in momentum in the market.
For a strong breakout, the MACD histogram expands, however when momentum falls, the MACD histogram reduces in size.
You can also watch the divergences between the histogram and price action.
Relative strength index (RSI)
The RSI divergences with the price action is a strong signal for a possible trend reversal.
If the price reaches higher highs but RSI is not able to to reach the new higher high, there is a bearish divergence. Sell on completion of the divergence
If price reaches the new low and RSI fails or forms a high, there is a bullish divergence.
Buy after noticing this kind of divergence.
False breakouts summary
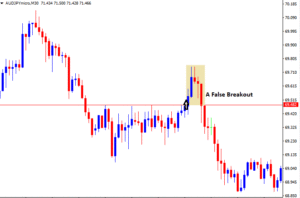
This happens when price breaks out the defined levels of support and resistance for a short time and does not continue but moves back to the opposite direction.
This is a night mare to most new traders since the breakout strategy is the simplest and easiest to trade.
On every attempt, you find yourself on the wrong side or mostly have premature knockouts which is so frustrating.
However the good news is that you can actually turn around and profit from this false breakout as long as you learn the tactic.
We can trade the false breakouts.
How do you trade false breakouts
To fade the breakouts is to trade the fake outs or trading in the opposite direction of a breakout.

Like we earlier said,trading fake outs is a bit tricky because a breakout may fail on its first attempt but ends up succeeding in the long run.
Therefore watch out for that. Fake outs mostly last for a short time, so only short term traders can benefit from it.
You can trade Fake outs the same way as breakout, except that false breaks are normally in the direction of the trend.
More so, fake outs turn out to be reversals when a breakout fails.
Whether trading forex breakouts and false breakouts, always wait for a clear confirmation before executing a position.
Use stop loss levels which will help you limit the loss in case a trade doesn’t go as expected.
How Does Greed Impact your Forex Trading Success?
There are several ways greed can impact your Forex trading success. Firstly, greed can make you abandon your well crafted trading strategy in favor of impulsive and speculative actions. Instead of adhering to predetermined entry and exit points based on technical or...
-
- Topic
- Voices
- Last Post


