
Yes, Gold False Break out can easily happen since the price is in a large daily congestion. But of course we can not rule possibility of trend continuation for a few days. Usually congestions give about 3 days in one direction and 2 days in the other so you don’t aim for too much when trading congestion phases.
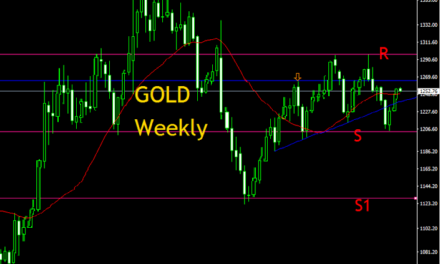
So we’re going to focus on the current daily candle breakout. Let’s look at the Gold Daily Chart levels that are likely to hold i.e zones where a price reaction could be expected.
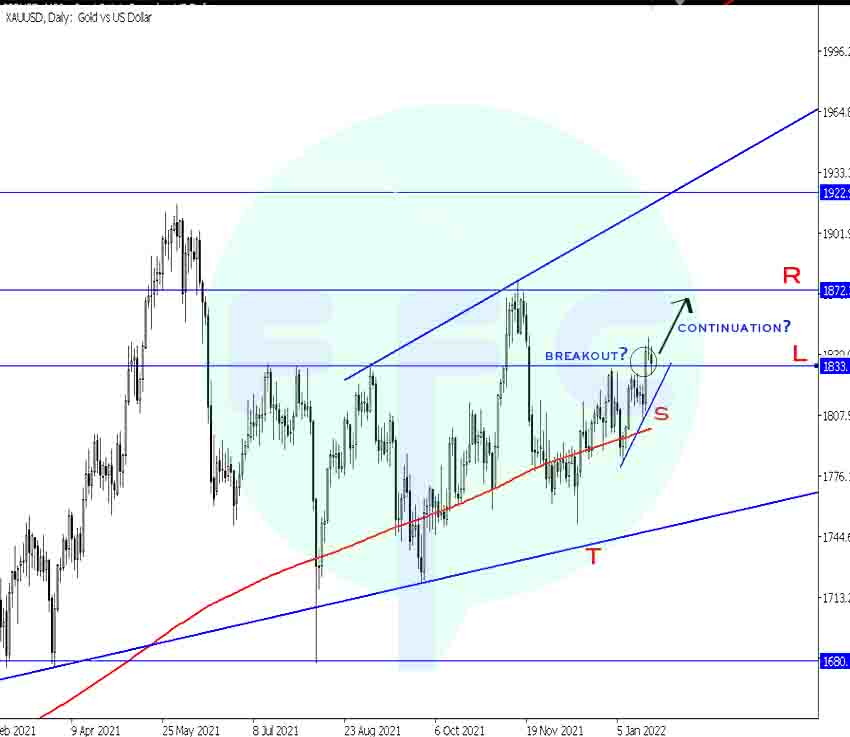
Looking at the chart above, we have candle close above resistance marked with horizontal line L. So, is it a continuation or a gold false break out?
If its a continuation, then immediate target is resistance zone marked with horizontal line R. Picking shorter targets is important in congestion phases as i mentioned before. Exit on R and Wait for price reaction on the R zone to confirm more upside or reversal at this point.
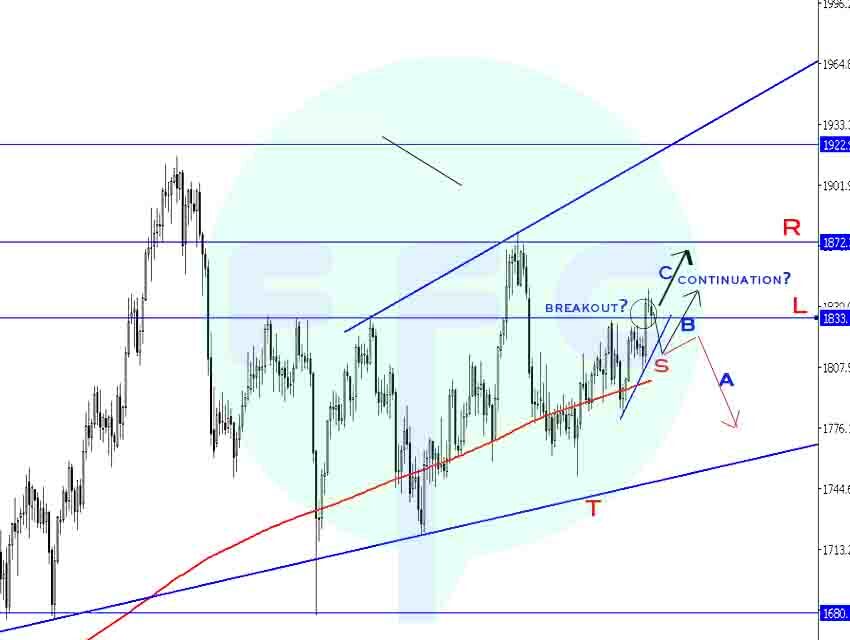
What if it’s a false breakout! What can you expect?
Gold False Break Out Analysis
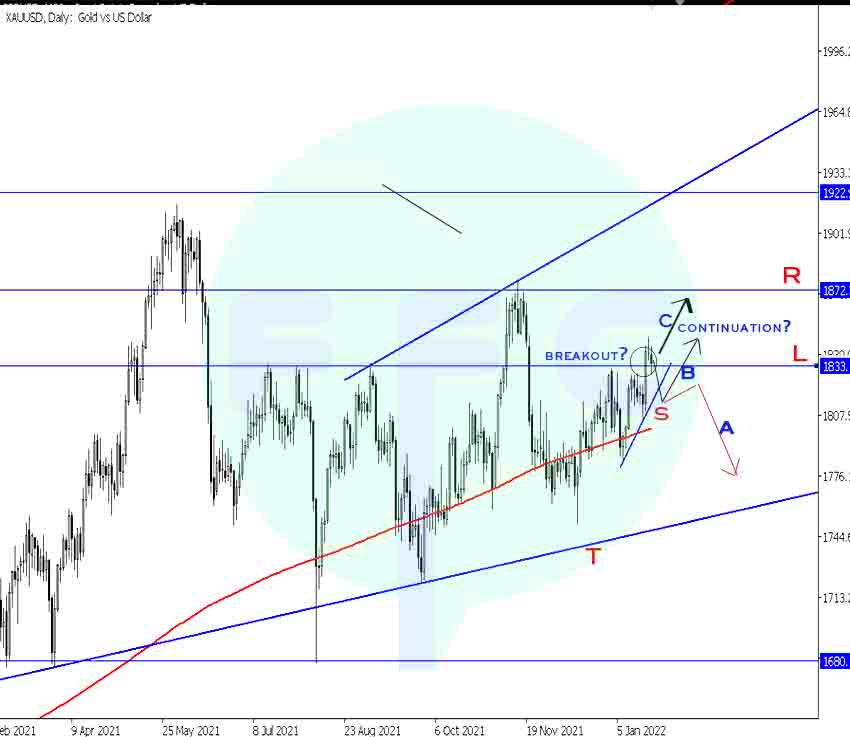
In this case, Immediate focus will be the small trendline S. A reaction on this small trendline will confirm if we having more downside back to major support trendline T. Or if there is more room for upside into R resistance zone
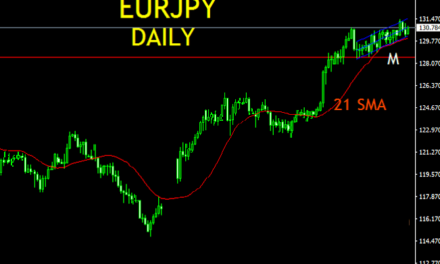
Of course lower timeframes like H4 (4-Hour) or H1 (hourly) will have some good swings to trade. Since we have a breakout on daily chart now. Drop to the smaller timeframes for any signs of price continuation
Price continuation signals could be chart patterns, channels, trendlines etc. This actually gives you tighter good stop levels.
Conclusion:
Price in congestion must be traded with caution. Always drop down to the smaller timeframes for entries and signals. Give so much respect to any top or bottom in the congestion

