
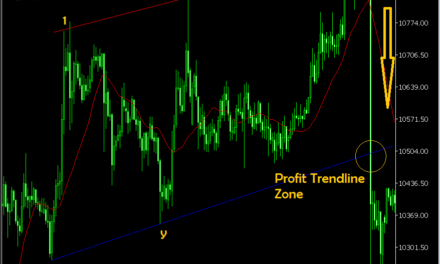
From our previous daily gold analysis here, the price movement was technically beautiful.
Being a 4th touch on the daily trendline in our previous article, the trendline break was likely as it fell into the weekly support channel.
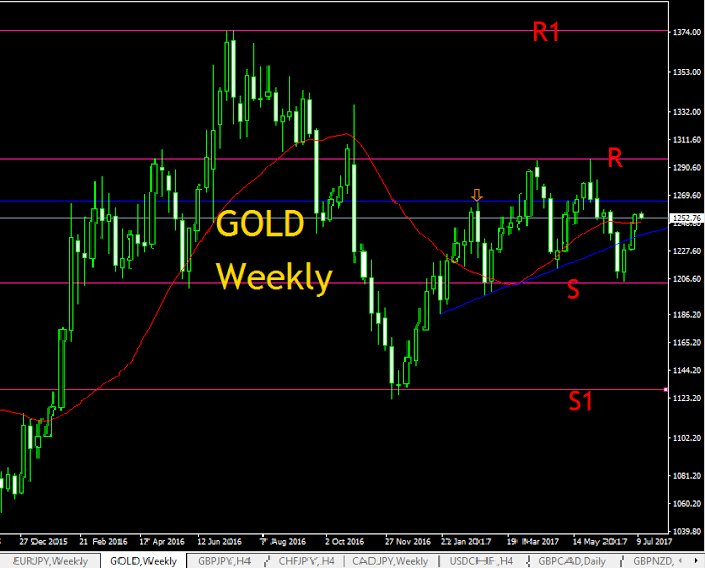
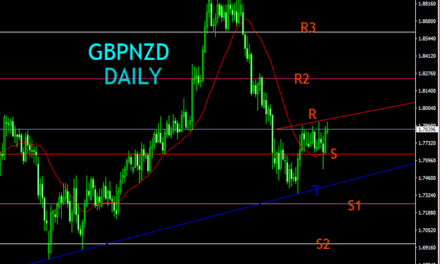
Currently the gold trader can see a clear congestion zone on the weekly chart, held by horizontal lines R and S.
The momentum in the channel is still strong either way, meaning that keeping the trading within the congestion zone now is most logical.
What’s within the congestion for the gold trader?
Break of that blue trendline to retest the lower weekly support showed some bearish bias.
This bias can only be maintained if the price fails to close above the blue horizontal resistance around 1264.8 and falls back strongly back to S.
Or otherwise we will still see indecision.
But the momentum too of the bounce off S for the last 2 weeks doesnt agree so much to above statement, it still shows chances of going higher to retest R getting back to the indecision mode.
After congestion…
Depending on the reaction and momentum in the R and S zones holding the congestion.
Weekly candle close above R may lead to retest of the larger resistance zone marked R1 around 1375.00 which corresponds to the larger monthly congestion resistance.
Weekly candle close below S may lead to retest of the previous lows support zone around 1129.00 marked S1

